How it works
A report template describes what to produce and in what form. You create a template of a given type, then link it to an export that generates it for a filtered scope (a learner, a session, a group…).
Template types
- CSV — tabular export: global, by result, by activity.
- PDF — summaries: global, results, activities, comments, or custom PDF (free layout).
- RTF or Word — office documents laid out in Word: certificate/attestation (as
.rtfor.docx), account record, login/time statistics. The full list of their variables, with examples, is in Variables for Word and RTF templates.
Create a custom template (PDF)
Open template management
in analysis / reporting.
Create a template
choose the type (e.g. custom PDF).
Build it
add pages and zones/sections, insert variables, set a page background.
Link an export
connect the template to an export that will apply a filter (session, group, learner).
Generate
the export produces the document (PDF, CSV or RTF).
Variables
In a custom PDF template, a variable is a token wrapped in @ signs that the platform replaces when it generates the document: @m_user_name@ becomes the learner's name.
The name reads in three parts: @ + family + _ + object + _ + data + @.
| Family | Meaning | Example |
|---|---|---|
m_ | Record data — it exists independently of any learner | @m_course_name@ (course title) |
t_ | Tracking data — it combines an object and a learner | @t_course_score@ (THIS learner's score on THIS course) |
h_ | Document context data | @h_date@, @h_pager@ |
The available objects are user, group, session, site, course (course), sco (activity), question, competency and global.
The most used
Learner — @m_user_name@, @m_user_firstName@, @m_user_login@, @m_user_email@, @m_user_service@, @m_user_firstConnexionDate@, @m_user_lastConnexionDate@, @m_user_connexionTime@, @m_user_formationTime@, @m_user_connexionNb@
Course — @m_course_name@, @m_course_nature@, @m_course_objectifs@, @m_course_typicalLearningTimeDuration@ (planned duration), @m_course_completionRate@, and for tracking @t_course_score@, @t_course_state@, @t_course_time@, @t_course_firstConnexionDate@, @t_course_lastConnexionDate@
Session — @m_session_name@, @m_session_startDate@, @m_session_endDate@, @m_session_registerNbAPP@, @m_session_participationRate@, @m_session_completionRate@, @m_session_avgScore@, @m_session_nbLearnerPassed@ / Failed / Incomplete / NotAttempted
Survey questions — @m_session_quizSurveyRespondents@ / @m_course_quizSurveyRespondents@ (number of respondents) and @m_session_quizSurveyDetail@ / @m_course_quizSurveyDetail@ (answer detail as bars), for the "Survey (not scored)" questions of modules and quizzes (see Survey questions: collect opinions and read the results).
Certificates — @m_course_validationDate@ and @m_course_validationExpiry@ give the validation date and its expiry (validation + 2 years - 1 day). @m_course_scoValidationDate3@ gives the validation date of a specific activity in the course: replace 3 with its number, that is, its position in the course, chapters included (a dash if the activity is not validated). Prefer them to their @t_course_…@ equivalents in a certificate: they find the tracking data on their own, whereas the tracking variant can come out empty depending on the context.
The full list — over 250 variables — is available in the editor, sorted by object: click in a zone, then open the variable picker.
Loops
To repeat a block (one line per course, per learner, per activity), wrap it between two markers:
@loop_course_start@
   @m_course_name@ — @t_course_score@
@loop_course_end@
Loops exist for site, session, course, sco, group, user, question and competency, and they can be nested: a learner loop inside a course loop produces a cross-table of the two.
Charts
A zone can be a chart zone rather than a text zone. It then contains a single variable, for example @lsp_cSession@ (status breakdown for the session) or @mmasb_cCourse@ (min / average / max score per course). Skills radars, progress curves and histograms are also available.
These charts are drawn as vectors in the PDF: they stay sharp at any zoom level and when printed, and embed no image. Breakdowns come out as a ring (donut), skills as a radar, monthly series as bars, and the colours are those of the platform's checked palette — the same as on screen.
> What has changed. Until now, these charts were images produced by a library from 2010: pixelated text when printed, off-brand colours, and pie charts in fake perspective — a slice seen at an angle looks smaller than it is. Your existing templates need no changes: the same variables now produce the vector rendering.
Why not Chart.js, used elsewhere in the platform? Because the PDF is built by the server, where there is no browser: Chart.js needs a JavaScript engine to draw. Vector drawing gives the same visual vocabulary — donuts, radars — with a print quality that Chart.js, which produces an image, could not reach.
Two entries have been removed from the picker: "status breakdown bar" (it gave the same result as the ring breakdown) and "score/attempt curve" (no vector equivalent). Templates that used them keep working.
For a breakdown, the supplied templates use a stacked bar built in HTML instead: a table whose cells have a width and a colour. It is the recommended form for a part-to-whole view, and it fits into a text zone, with no chart zone.
How it works, if you want to reproduce it: the …Percent variables (@m_session_nbLearnerPassedPercent@) return "36%", which goes straight into the cell width — width:@m_session_nbLearnerPassedPercent@. The legend always writes the label next to the colour swatch: a photocopy, a black-and-white print or a colour-blind reader must still be catered for.
Ready-to-use templates
They are already installed. The twenty-three templates supplied by DGT Concept come with the platform and appear in Analysis → Templates after an update — there is nothing to import.
> If you had already imported and then edited one of them, your version is kept: the update replaces nothing and creates no duplicate. It only installs templates whose name is missing.
Manual import is still available for your own templates: a custom template is exported as a .zip and re-imported on another instance from Templates → Import a template.
Their name starts with "dgtconcept - " (for example "dgtconcept - Bilan de session"): in the list of templates they are grouped together and stand out at a glance from your own templates. A copy you make keeps the name you give it.
Hover over their name to discover them. In Analyse → Templates, moving the mouse over the name of a "dgtconcept - …" template (or reaching it with the Tab key) shows a preview of its typical page and a sentence saying what it contains and who it is for: enough to pick the right report without generating it first.
The twenty-three templates:
| Template | One document per… | Content |
|---|---|---|
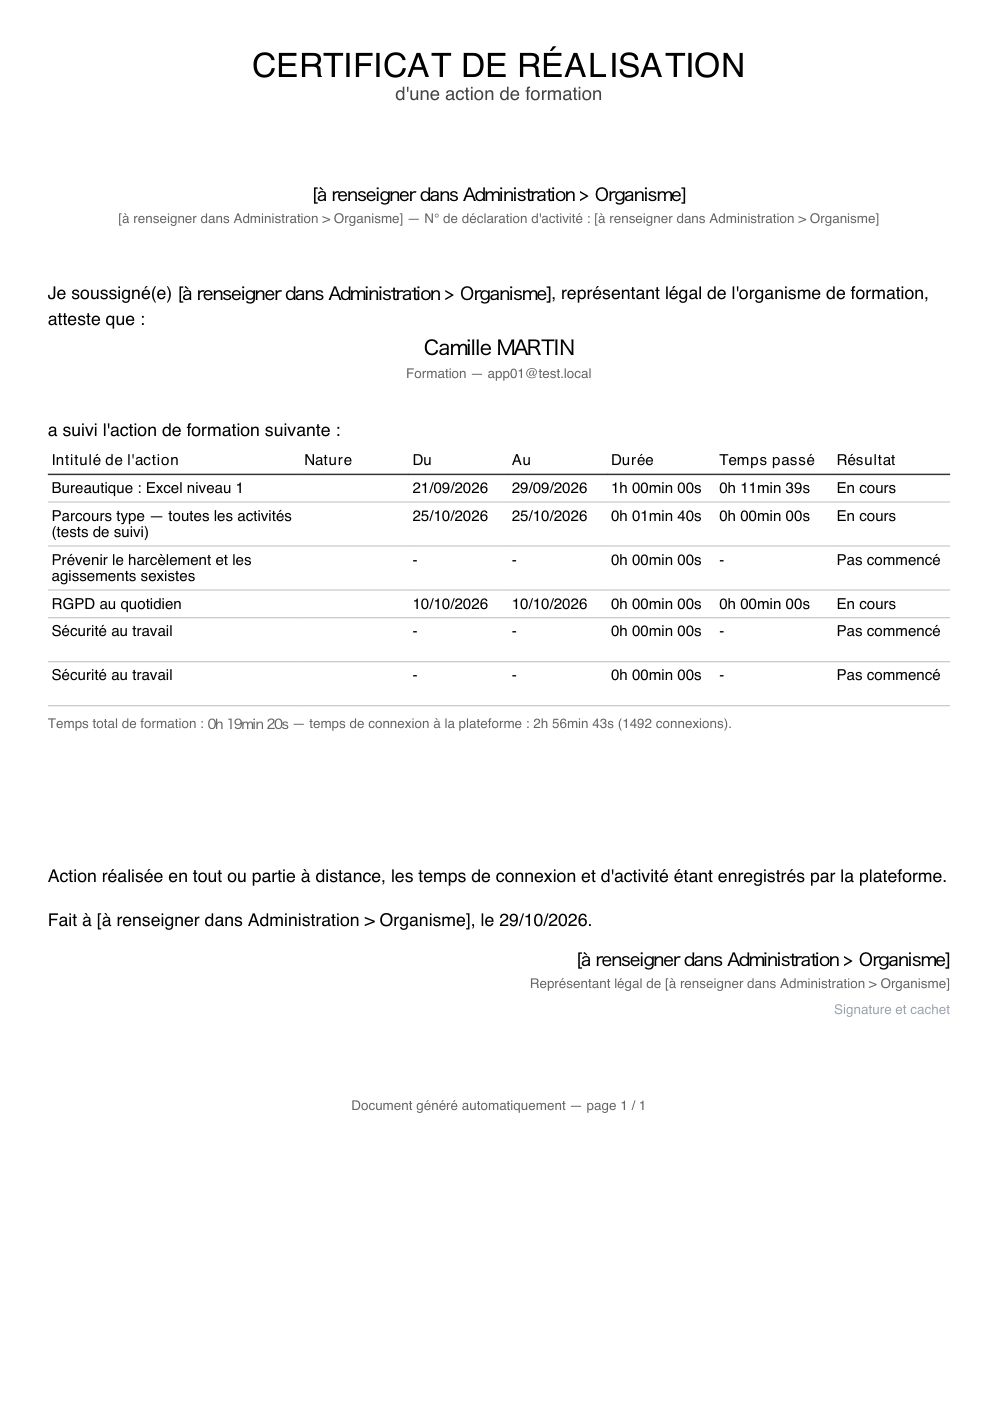
| Certificate of completion (Certificat de réalisation) | learner | training followed, dates, durations, time spent, result, legal details and signature |
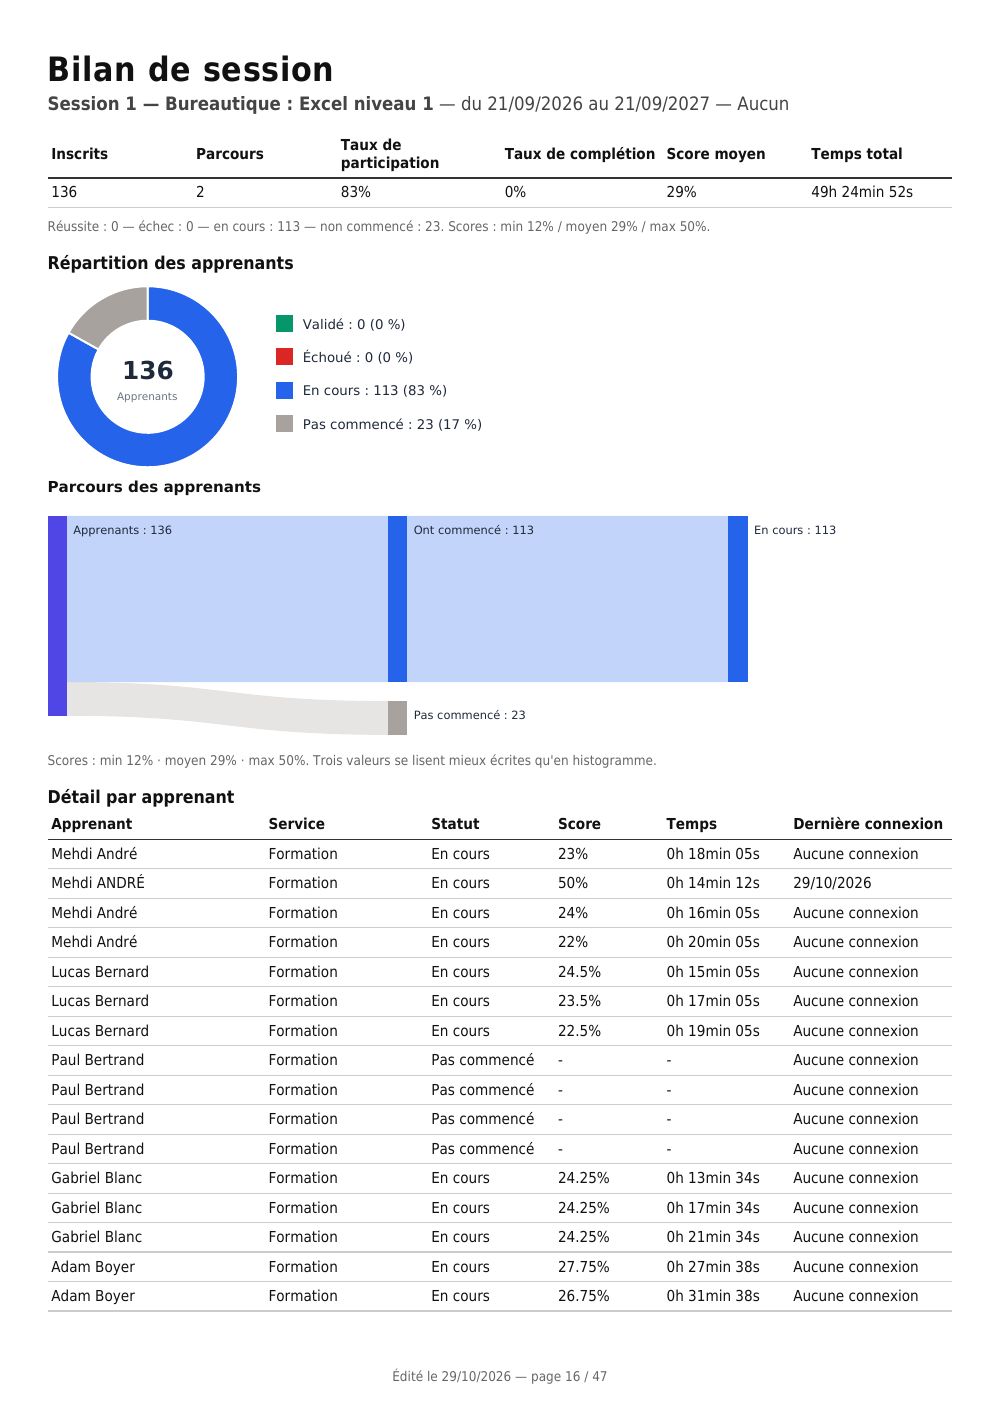
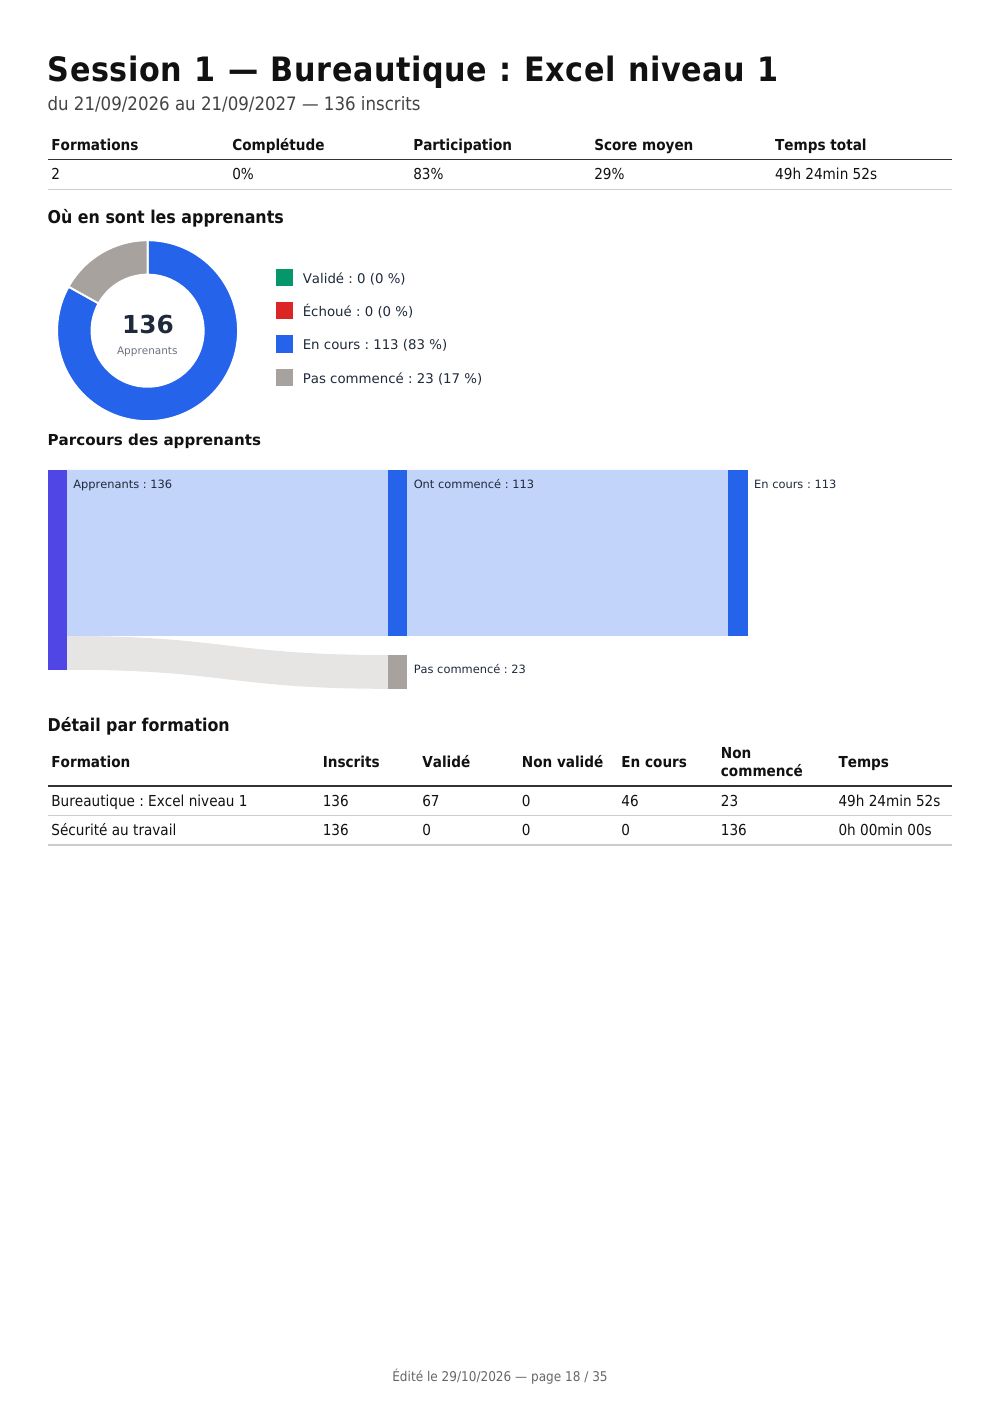
| Session summary (Bilan de session) | session | figures at a glance, pie chart of statuses, score histogram, learner detail |
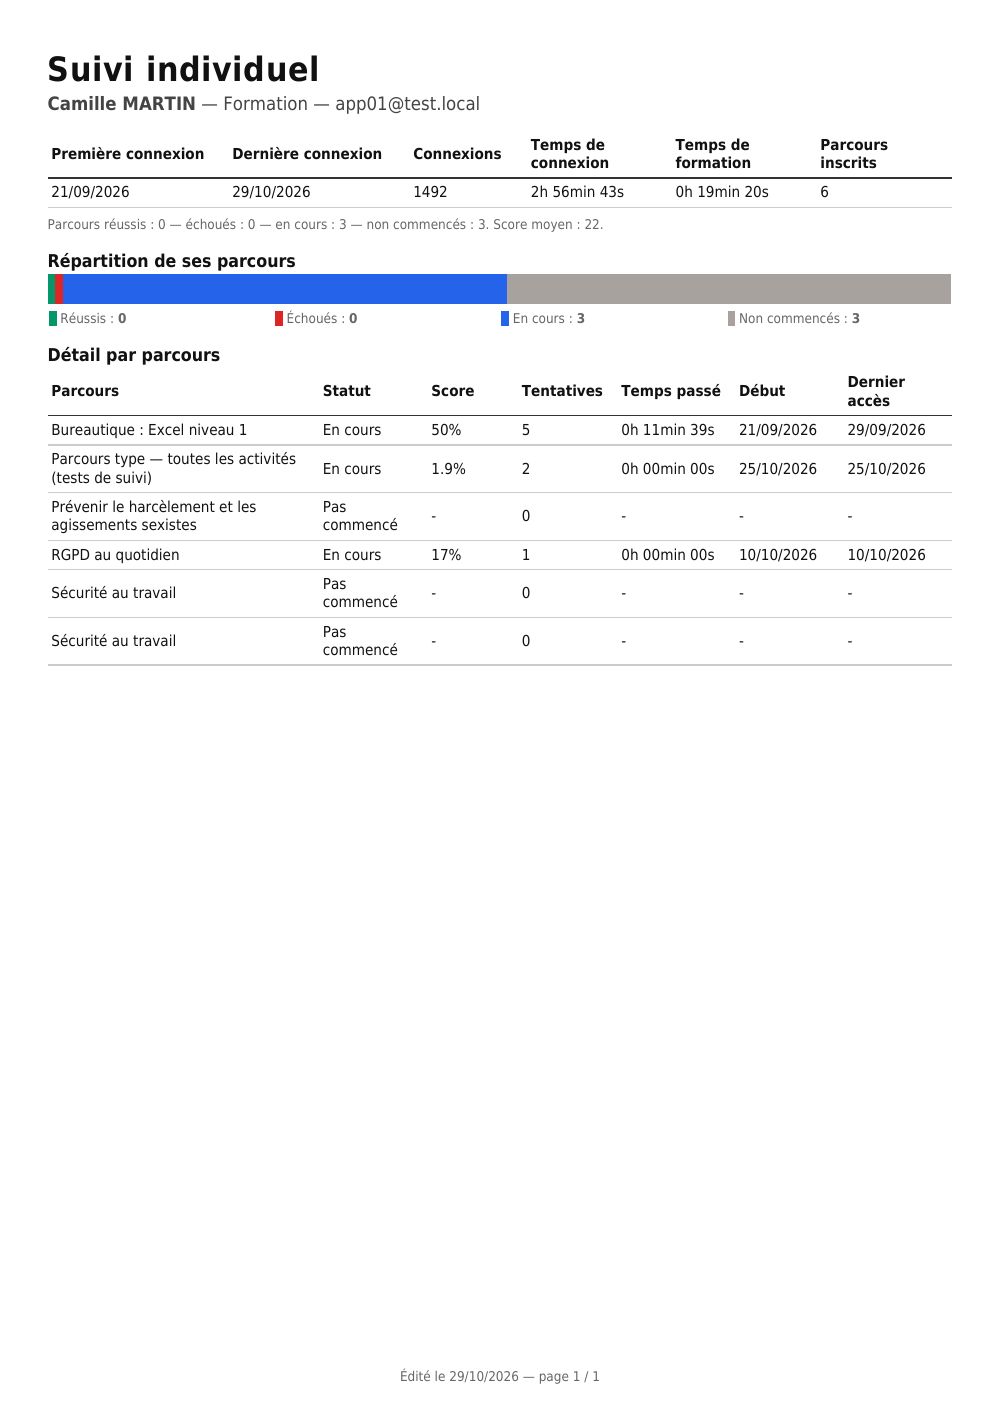
| Individual learner tracking (Suivi individuel apprenant) | learner | volume of activity, score radar, status breakdown, detail by course |
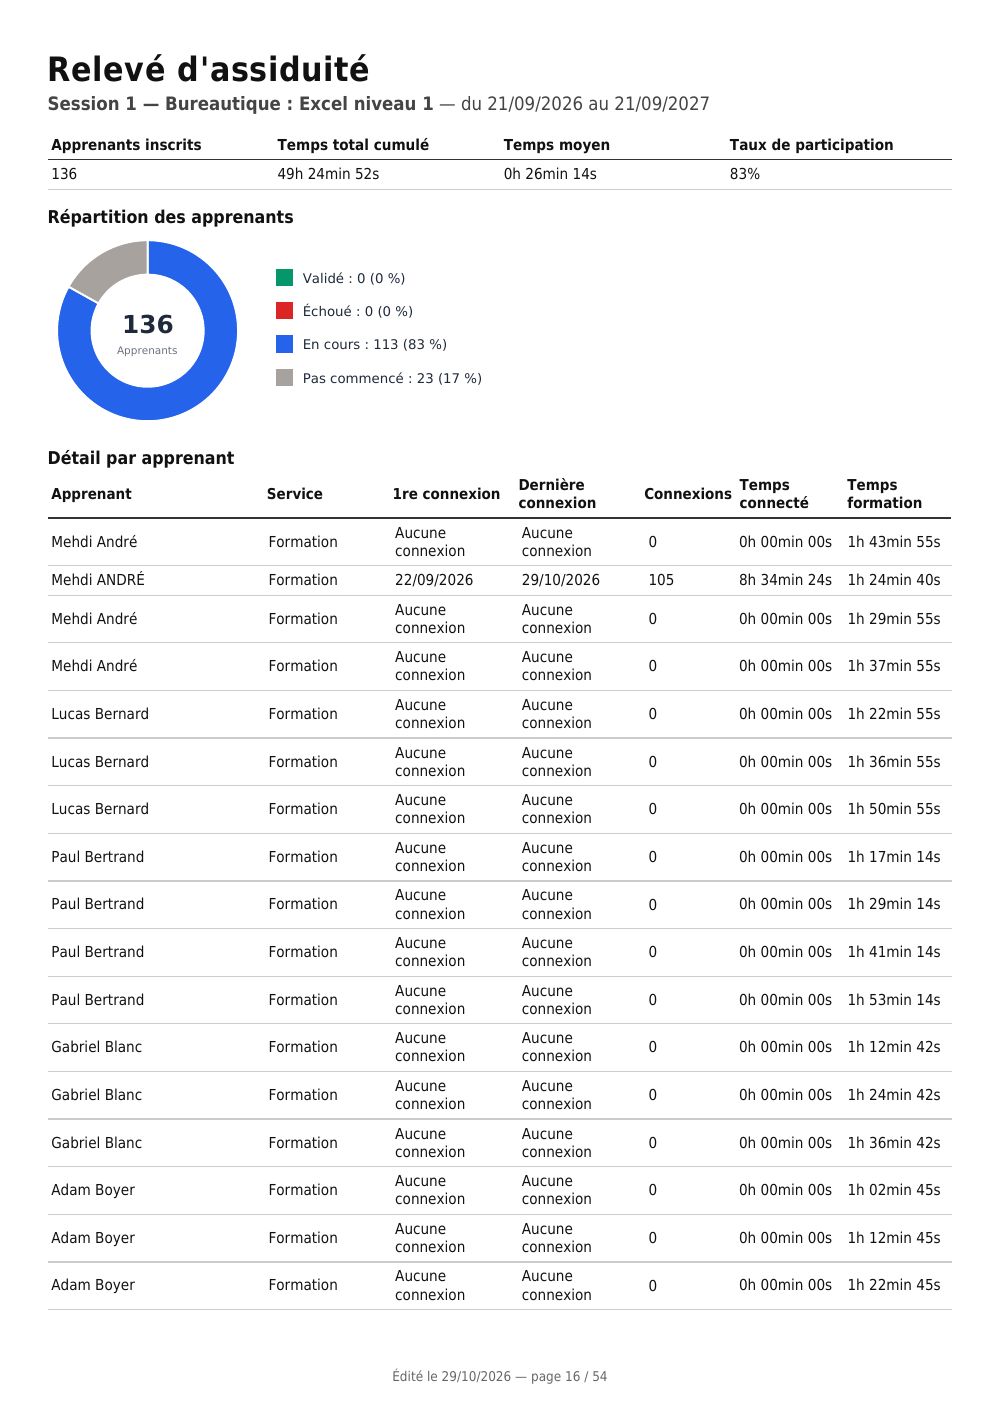
| Attendance and logins (Assiduité et connexions) | session | the remote attendance record: logins, time logged in, training time |
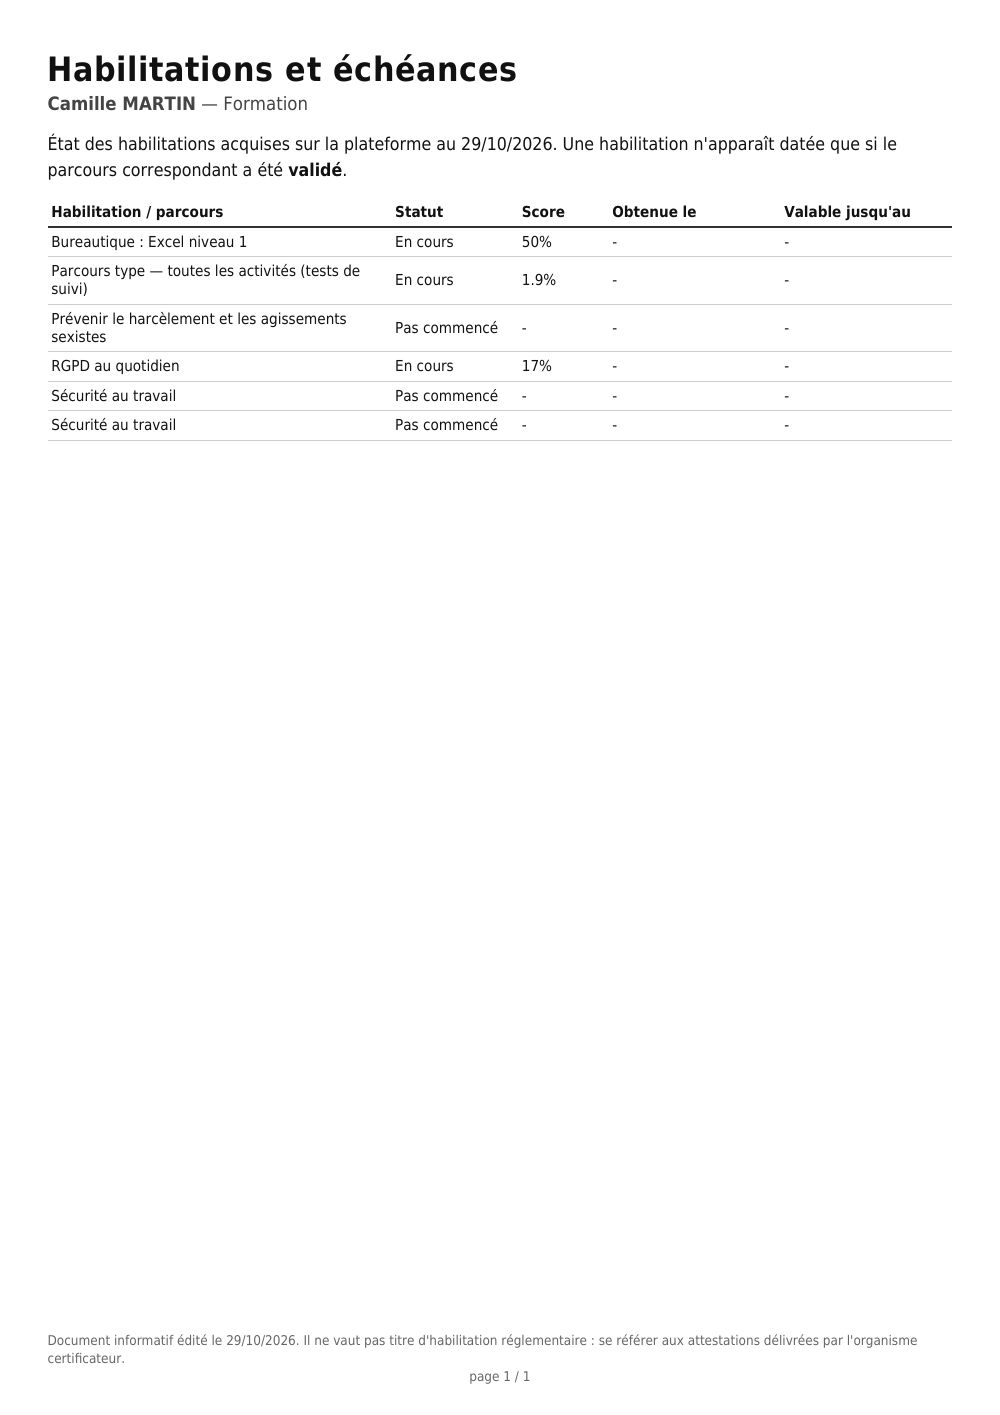
| Certifications and expiry dates (Habilitations et échéances) | learner | certifications obtained, date obtained and expiry date |
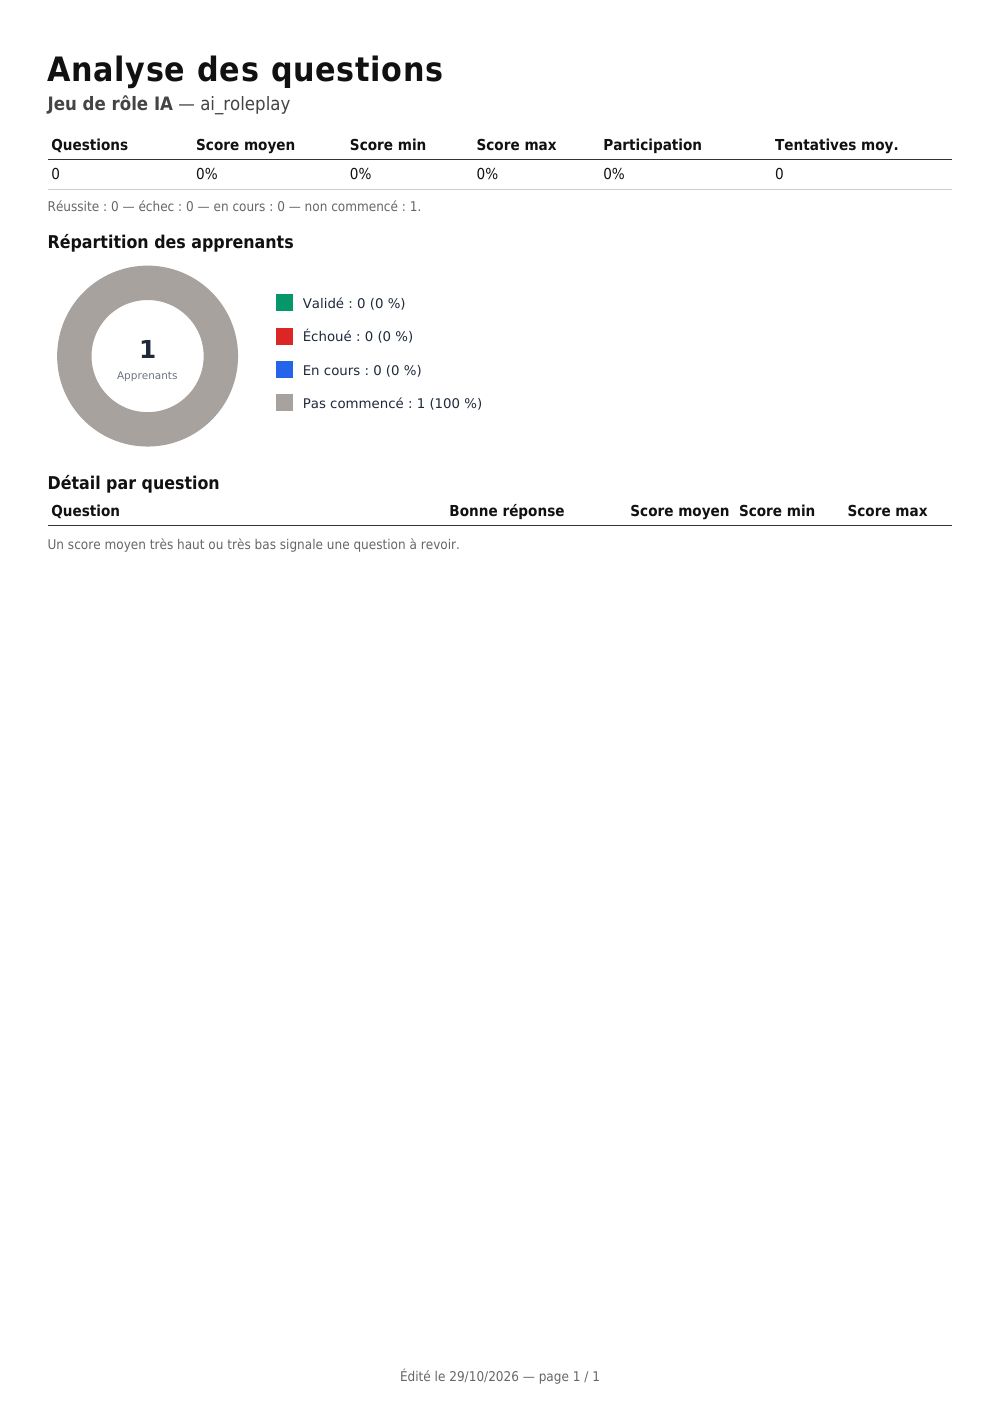
| Question analysis (Analyse des questions) | activity | statistics per question, to spot the ones to review |
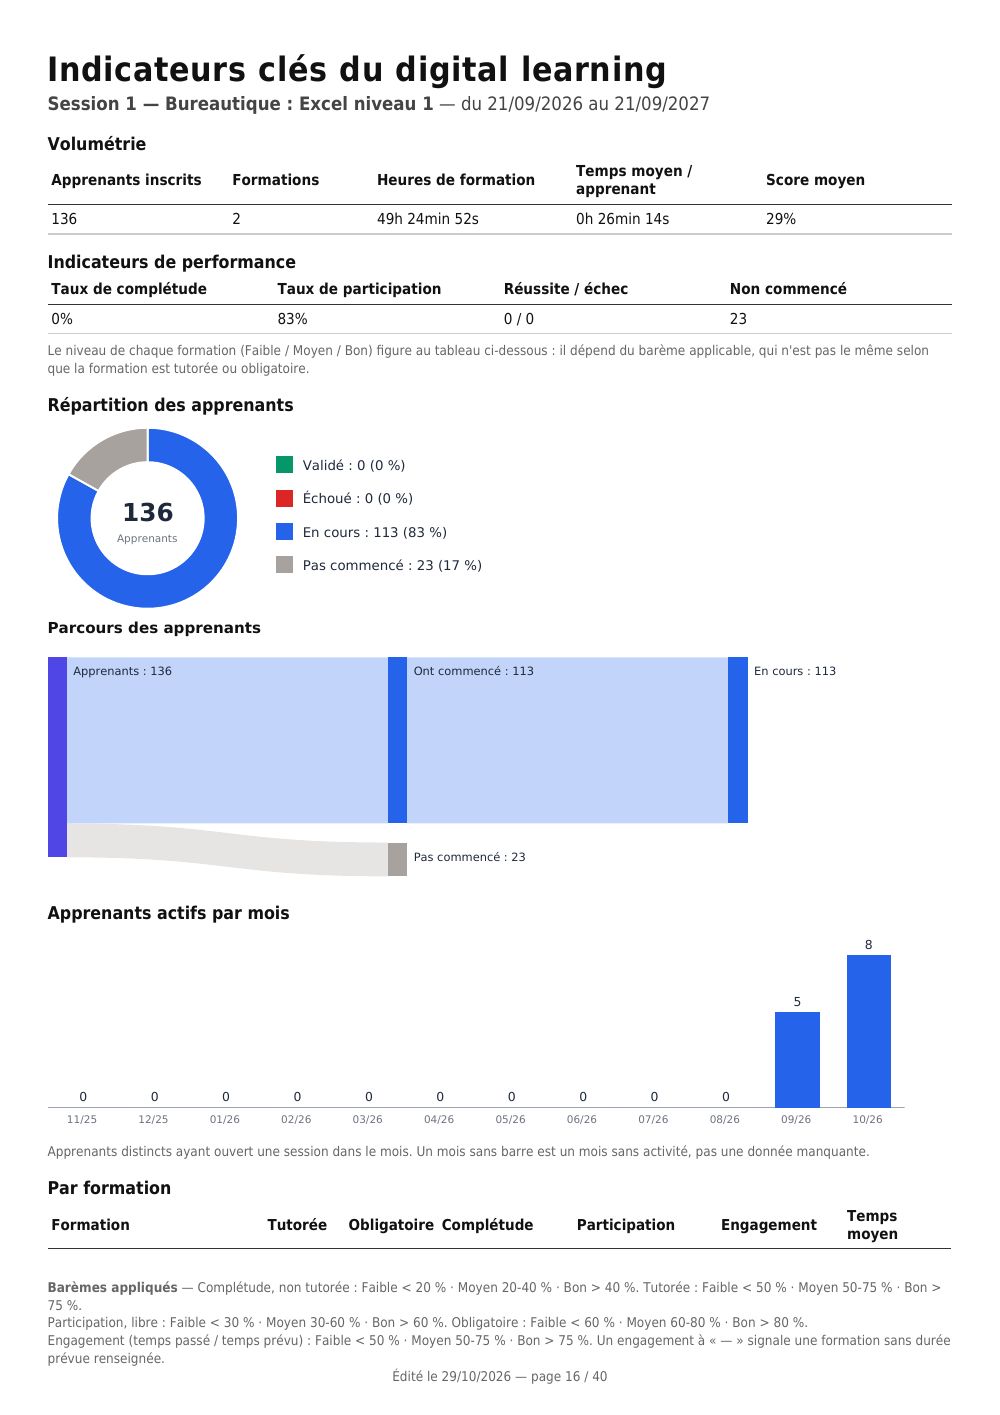
| Digital learning KPIs (KPI digital learning) | session | the key indicators, with their level Low / Medium / Good |
| Satisfaction survey (Enquête de satisfaction) | session | response rate, satisfaction, NPS, then the detail question by question |
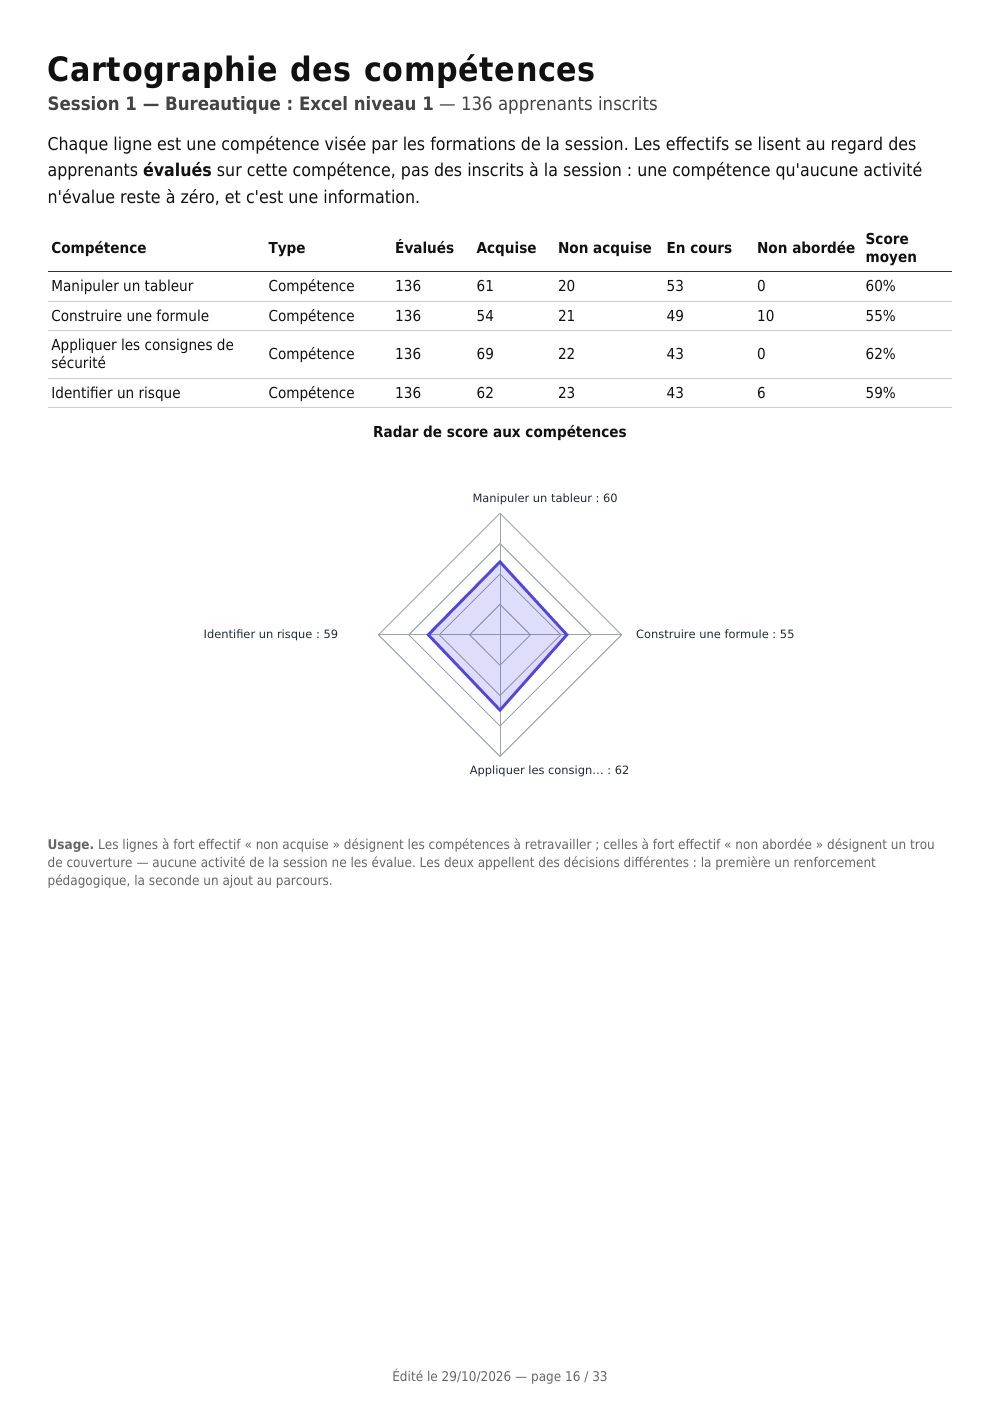
| Skills map (Cartographie des compétences) | session | what has been acquired, what remains to be covered, skill by skill |
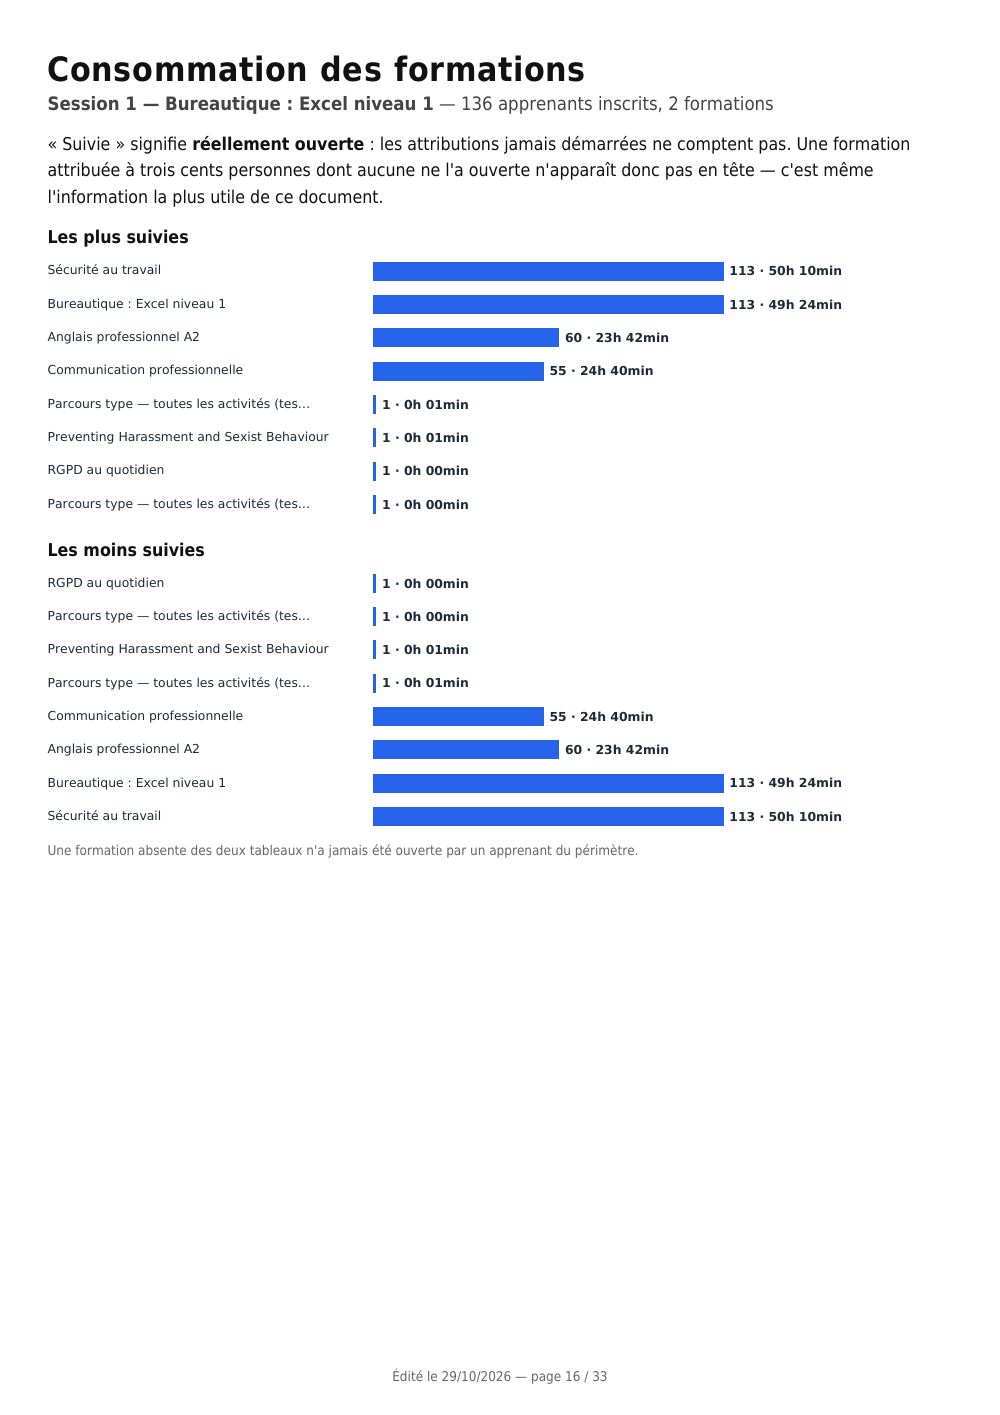
| Most and least followed courses (Formations les plus et les moins suivies) | session | the ranking by actual use |
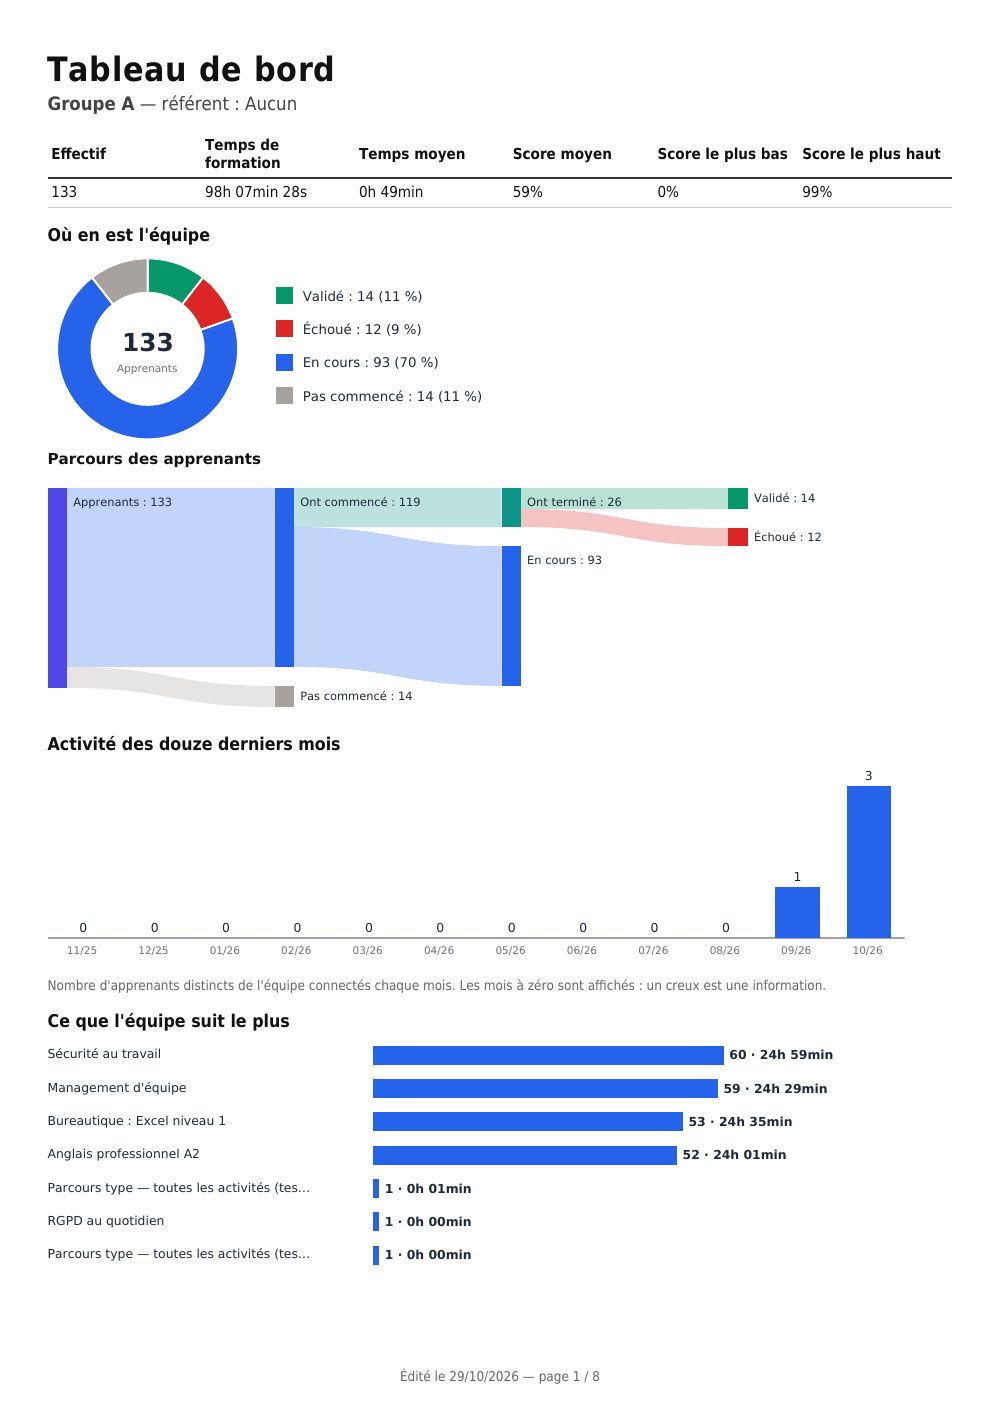
| Line manager dashboard (Tableau de bord manager) | group | a team's document: headcount, progress, activity, what it is following |
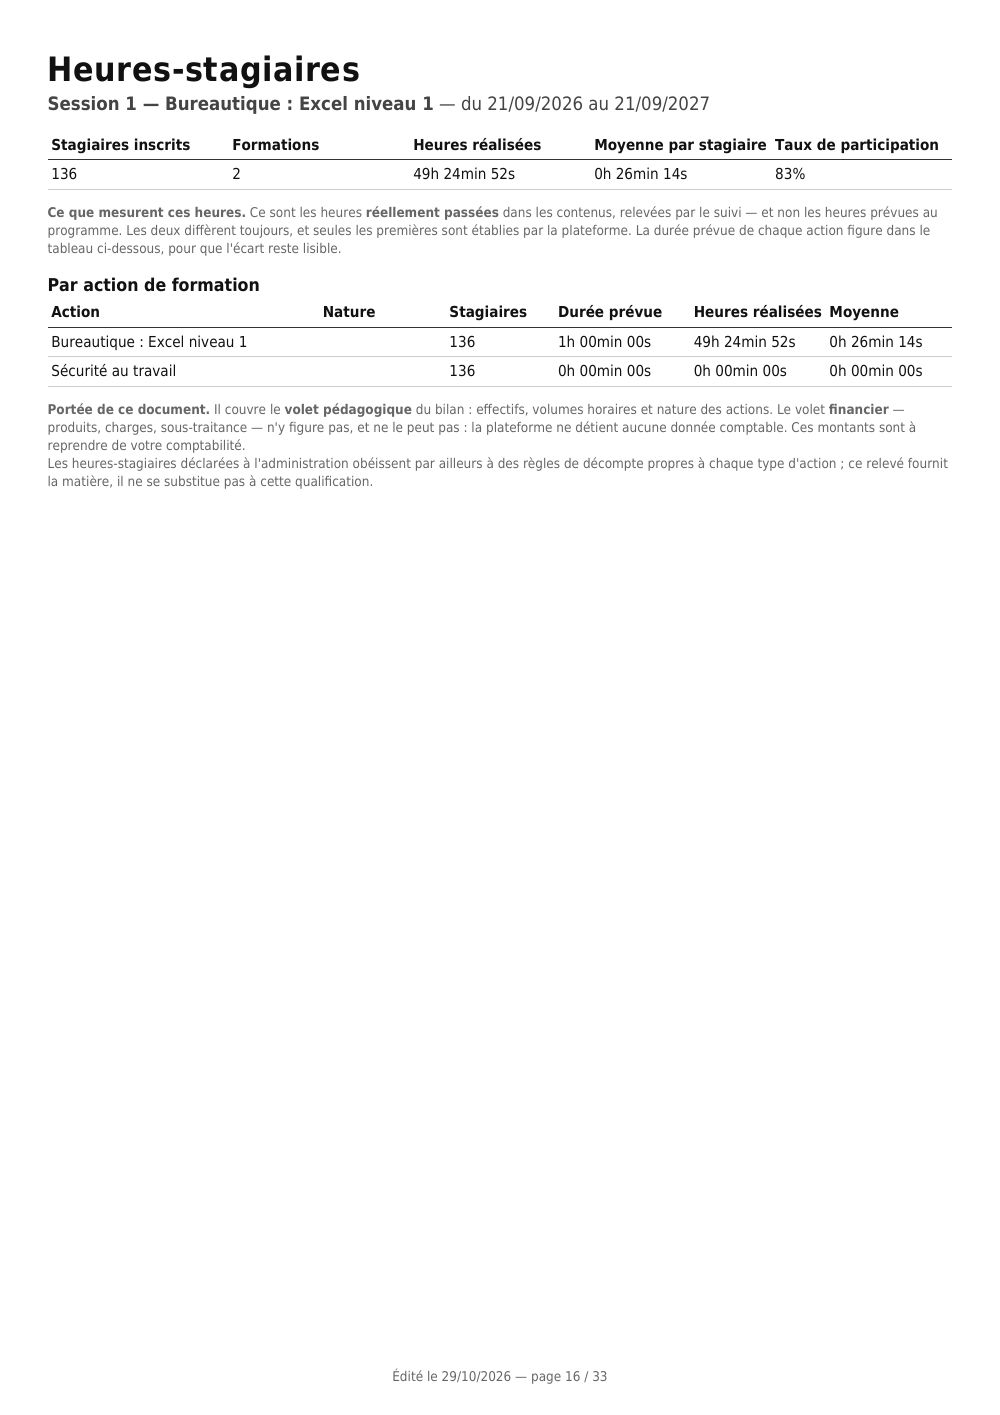
| Trainee hours (Heures-stagiaires) | session | headcounts and hours — the educational part of the annual report |
| Skills gaps by position (Écarts de compétences par poste) | learner | what the position requires, what has been acquired, what is missing |
| Global report (Rapport global) | the whole platform | your spaces, headcounts, the list of sessions — click a session to go to its detail |
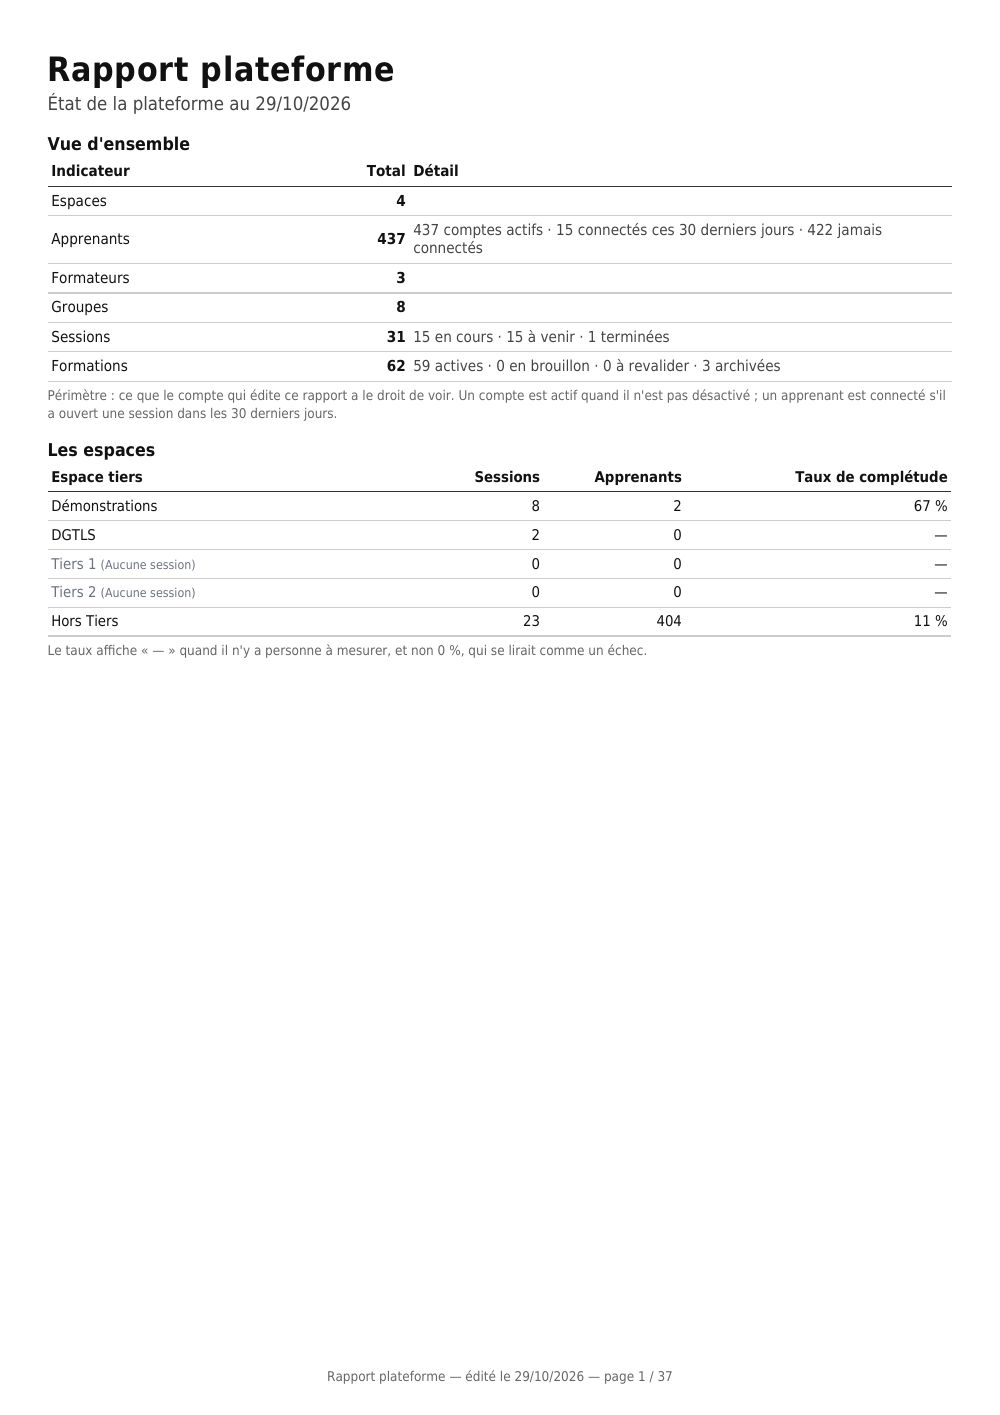
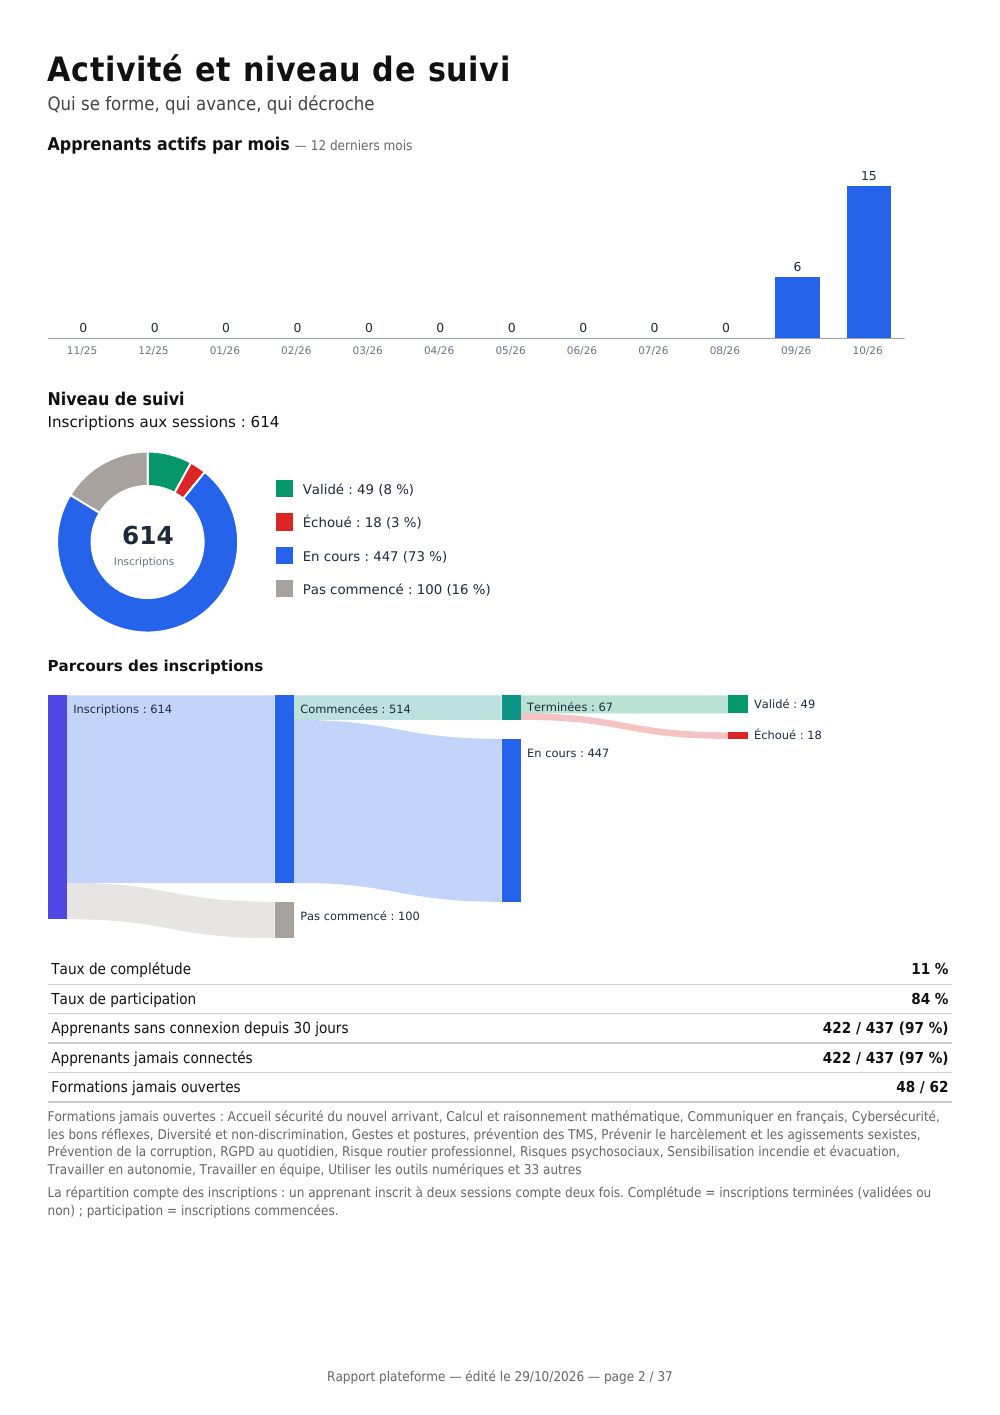
| Platform report (Rapport plateforme) | the whole platform | overview, activity and follow-up level, then a Courses page, a Groups page and one page per session |
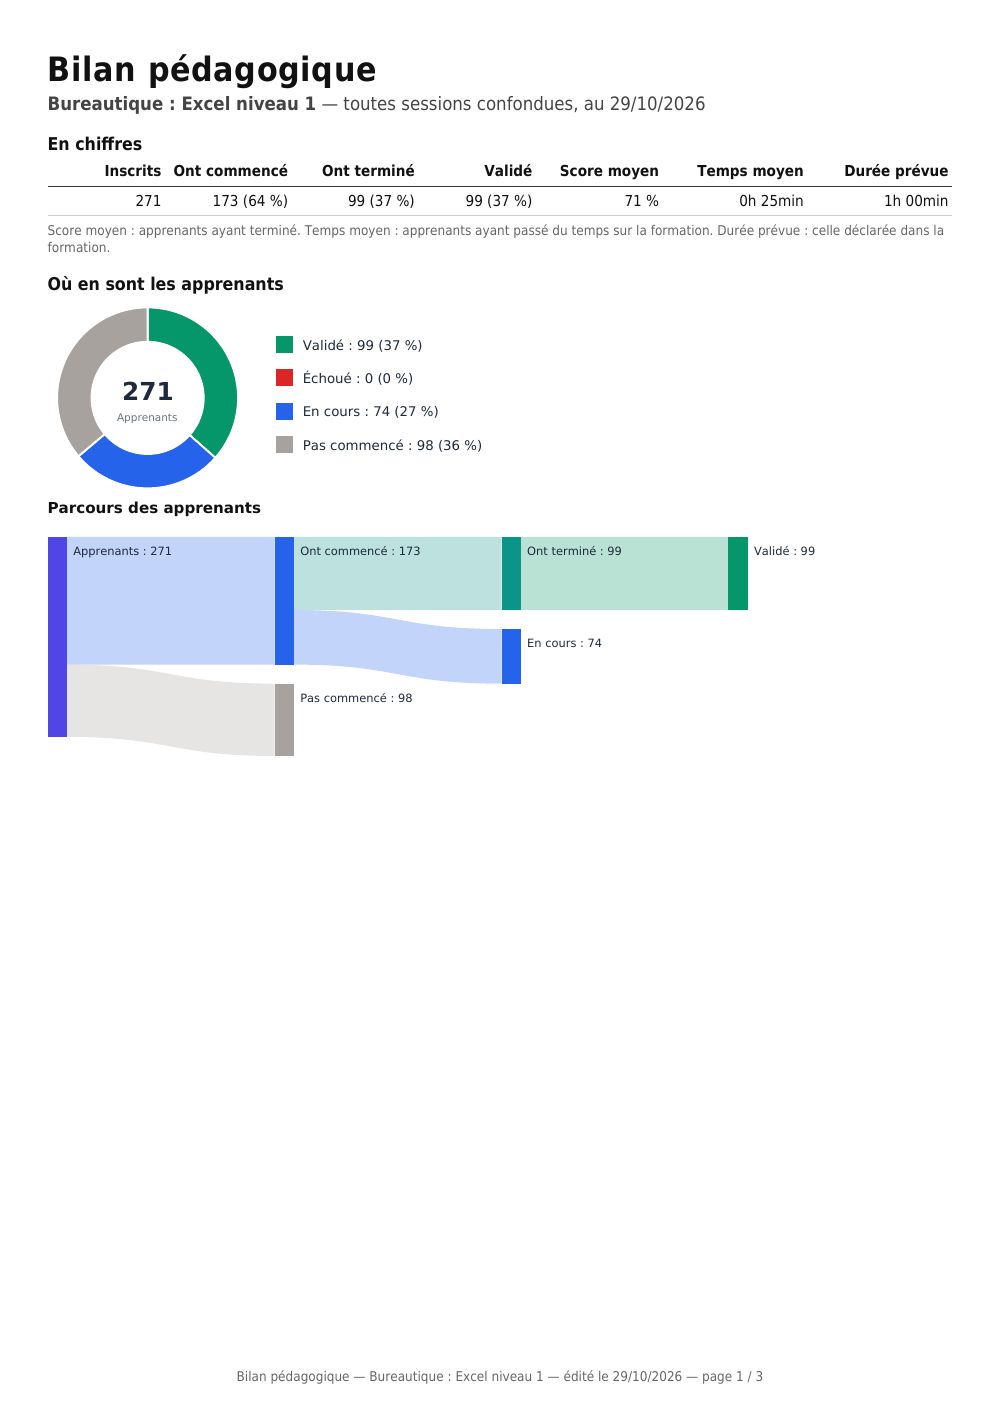
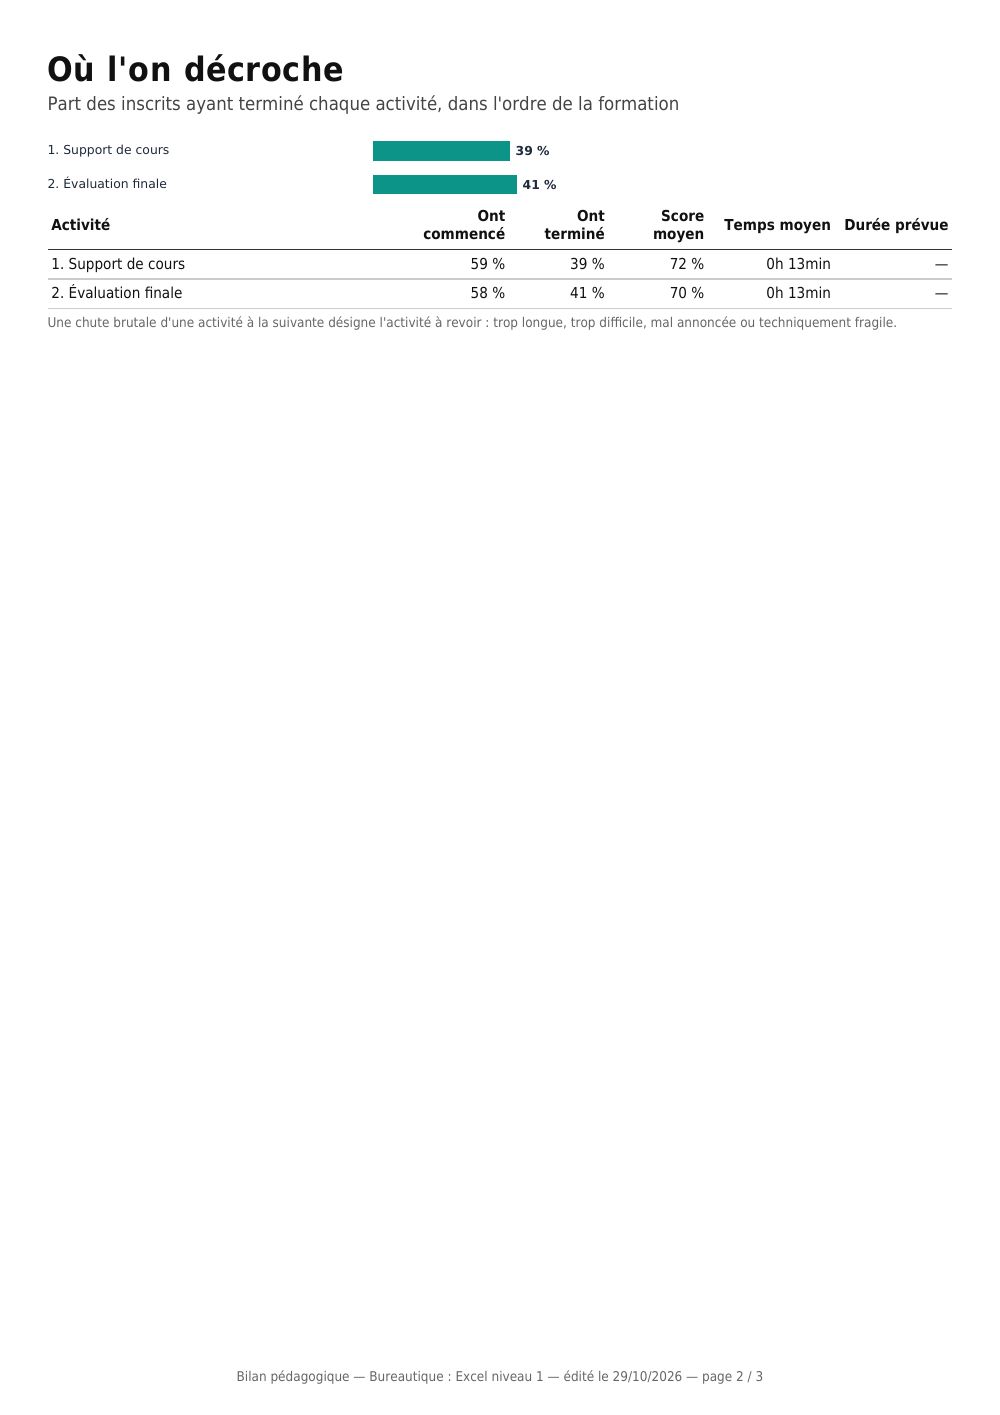
| Course learning review (Bilan pédagogique de la formation) | course | headcounts, learner breakdown and flow, drop-off activity by activity, least successful questions, satisfaction |
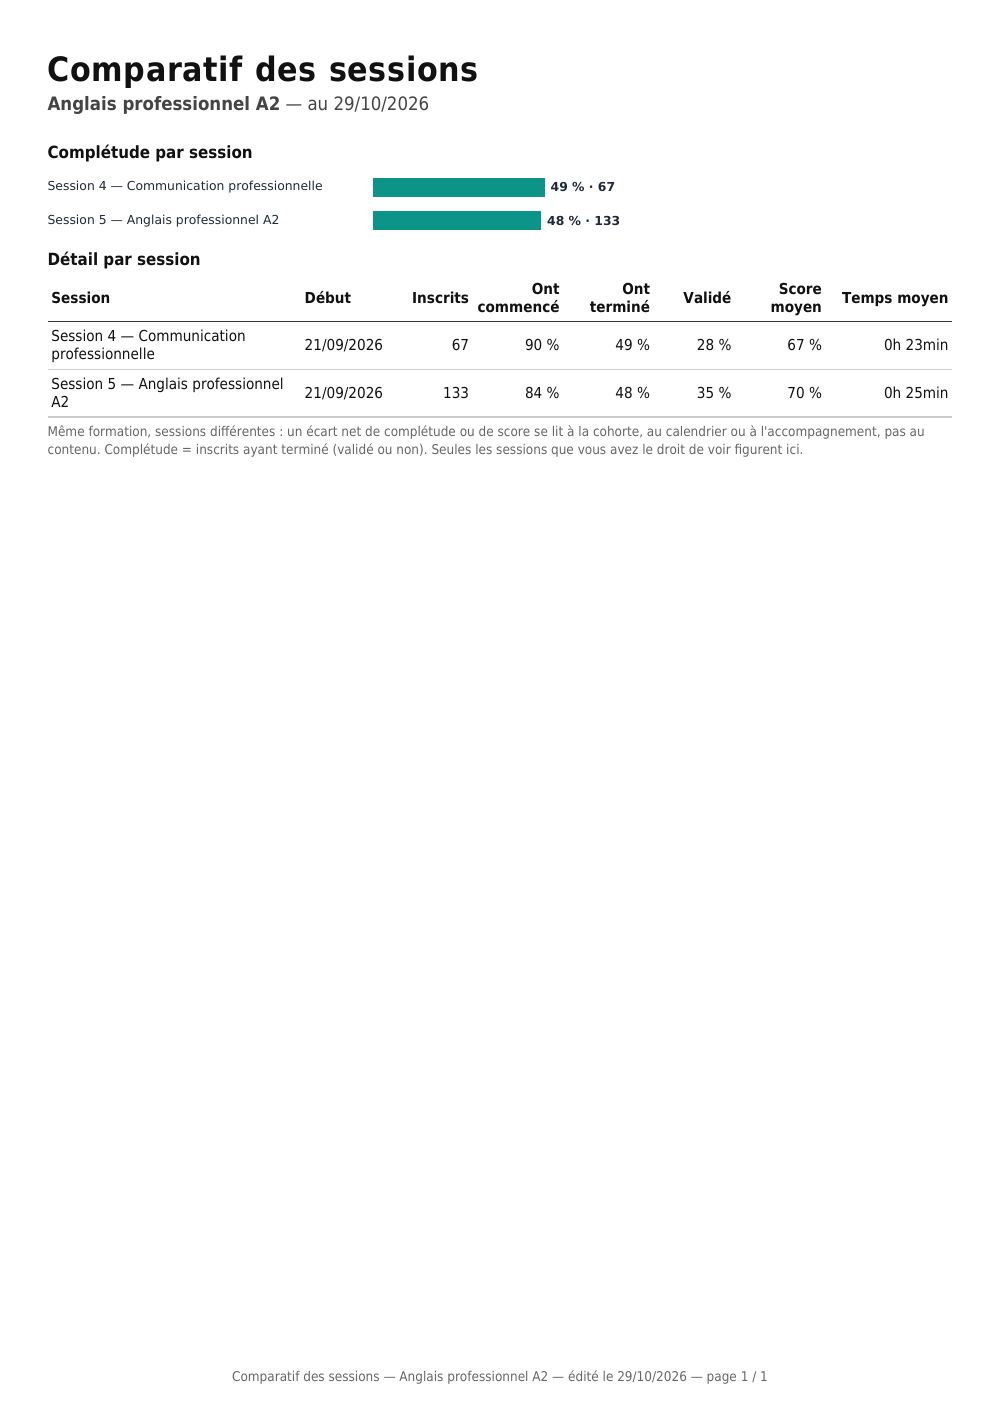
| Session comparison for a course (Comparatif des sessions d'une formation) | course | each session that includes it: enrolments, completion, average score and time, ranked |
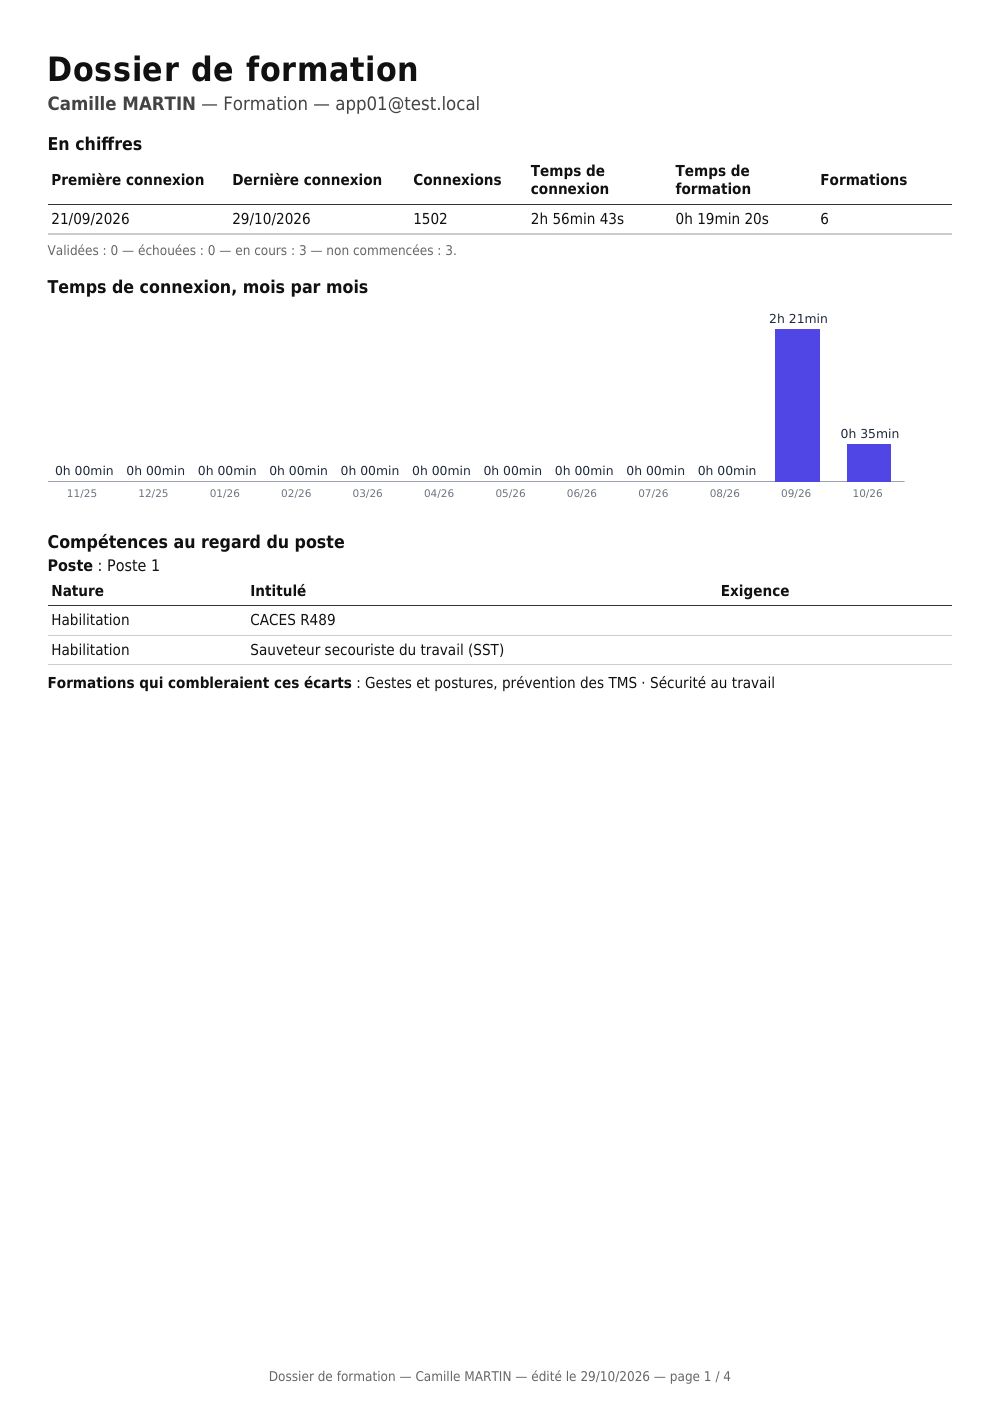
| Learner training file (Dossier de formation de l'apprenant) | learner | summary, monthly time, skills gaps, each course activity by activity, certifications |
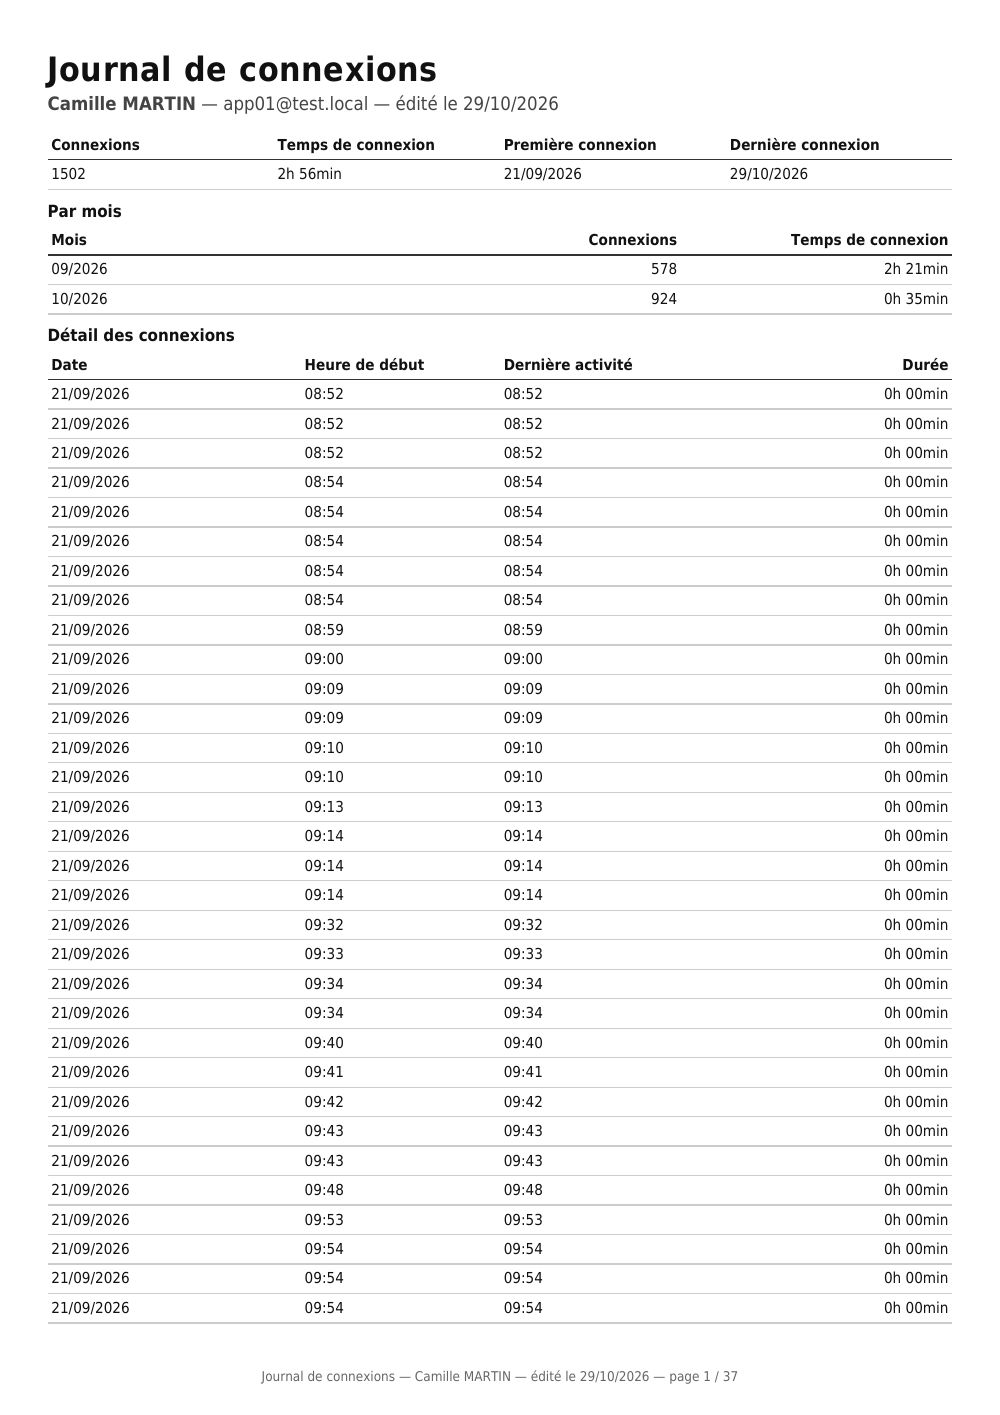
| Login log (Journal de connexions) | learner | each login time-stamped with its duration, monthly totals, time per course |
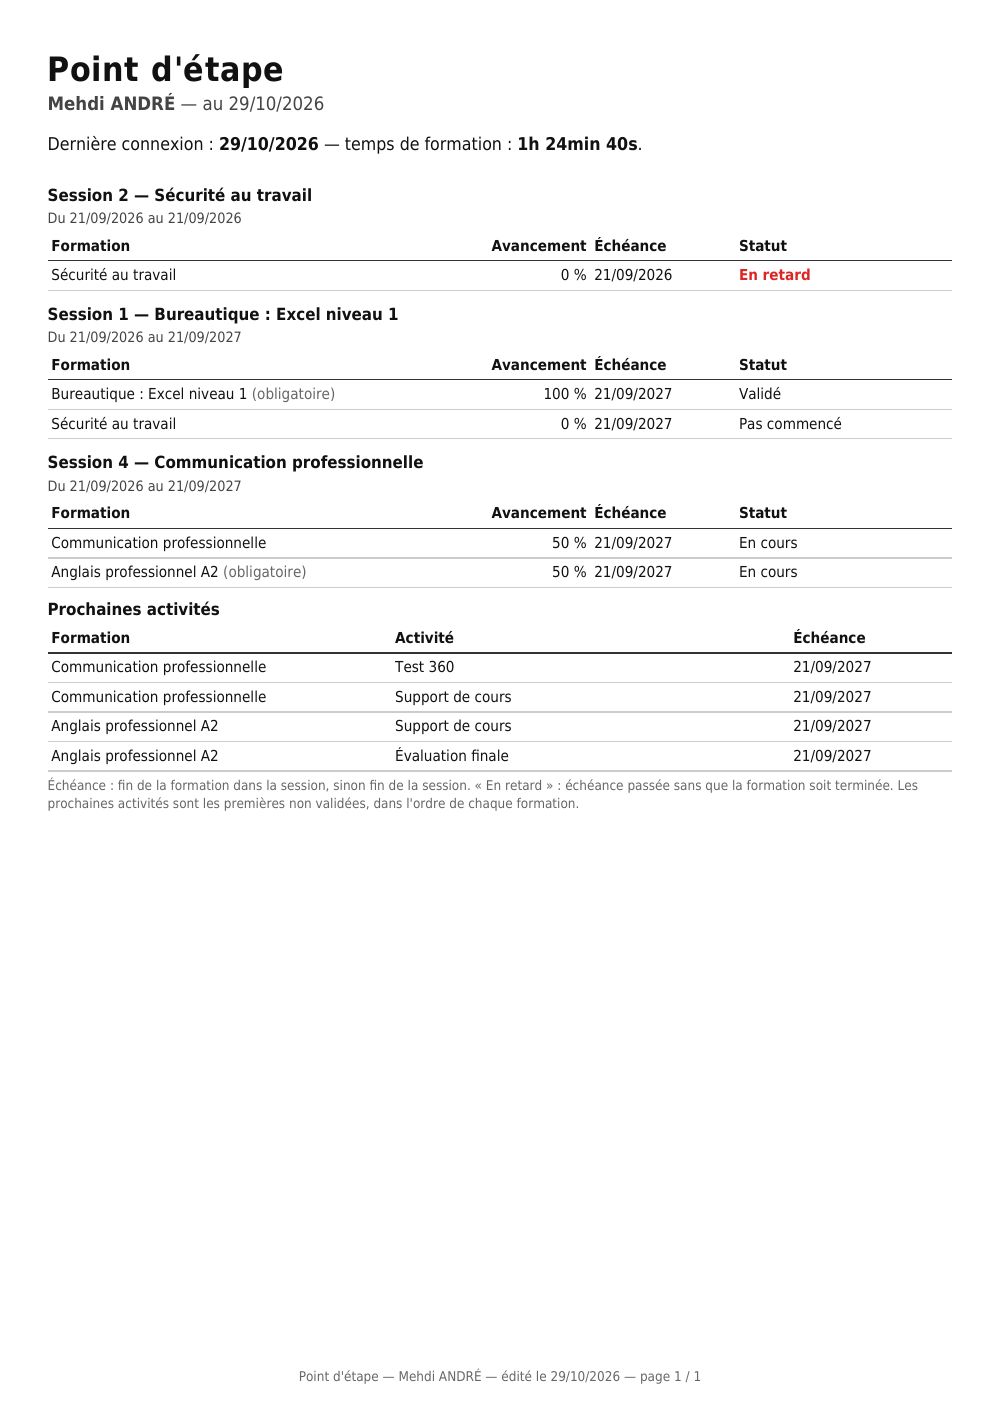
| Learner progress check (Point d'étape apprenant) | learner | progress in each course, deadlines, delays, next activities |
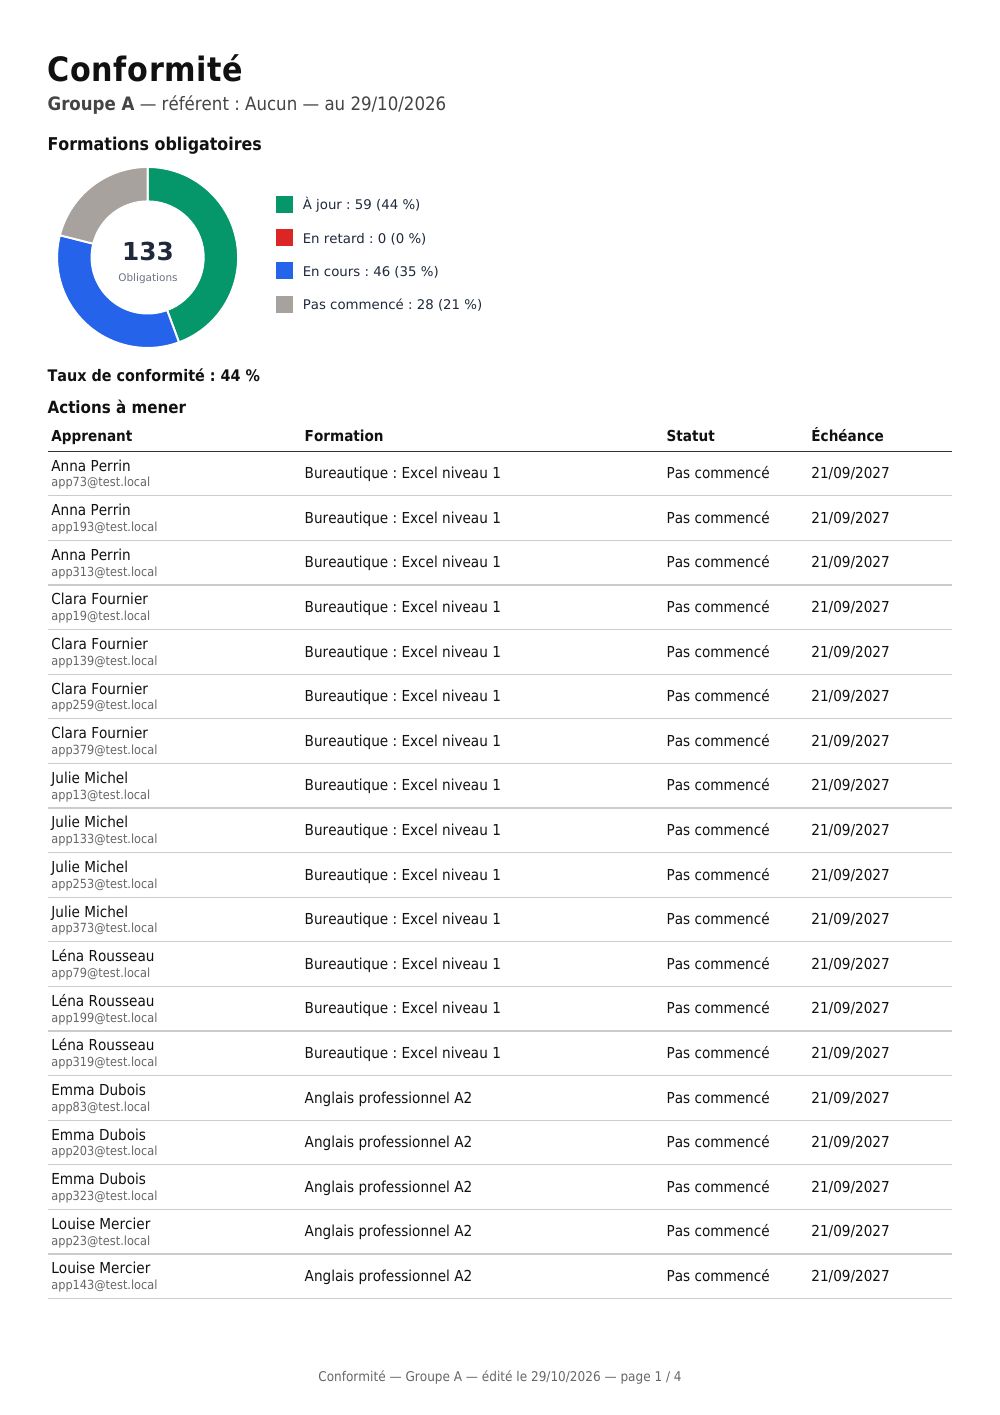
| Mandatory training compliance (Conformité des formations obligatoires) | group | who is up to date, who is overdue, actions ranked by urgency, certifications to renew |
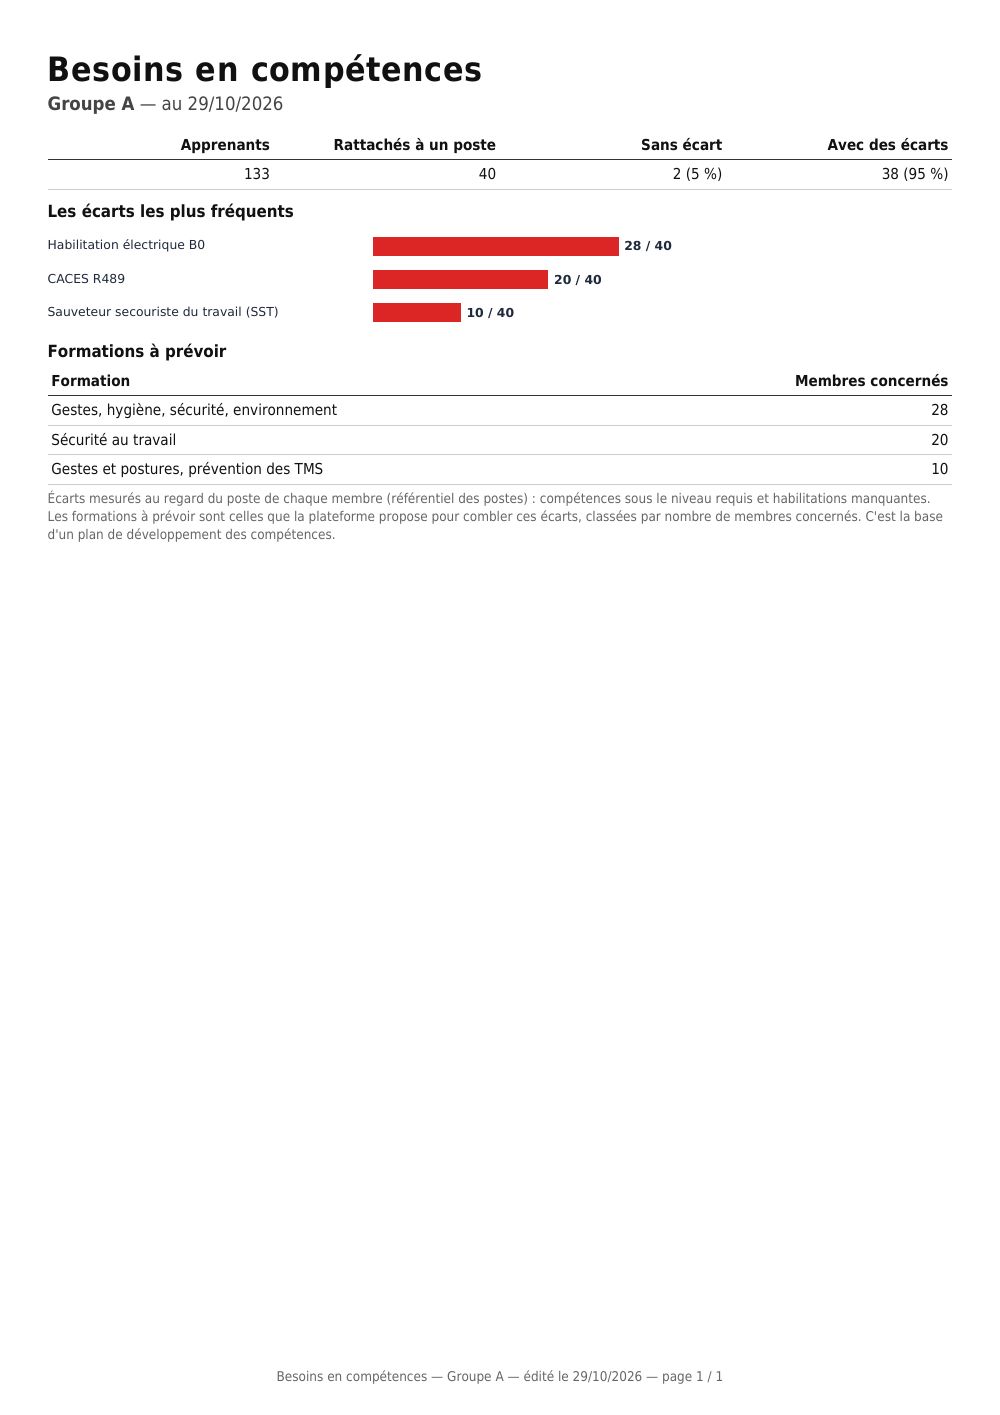
| Group skills needs (Besoins en compétences du groupe) | group | gaps against job requirements, the most frequent ones, courses to plan |
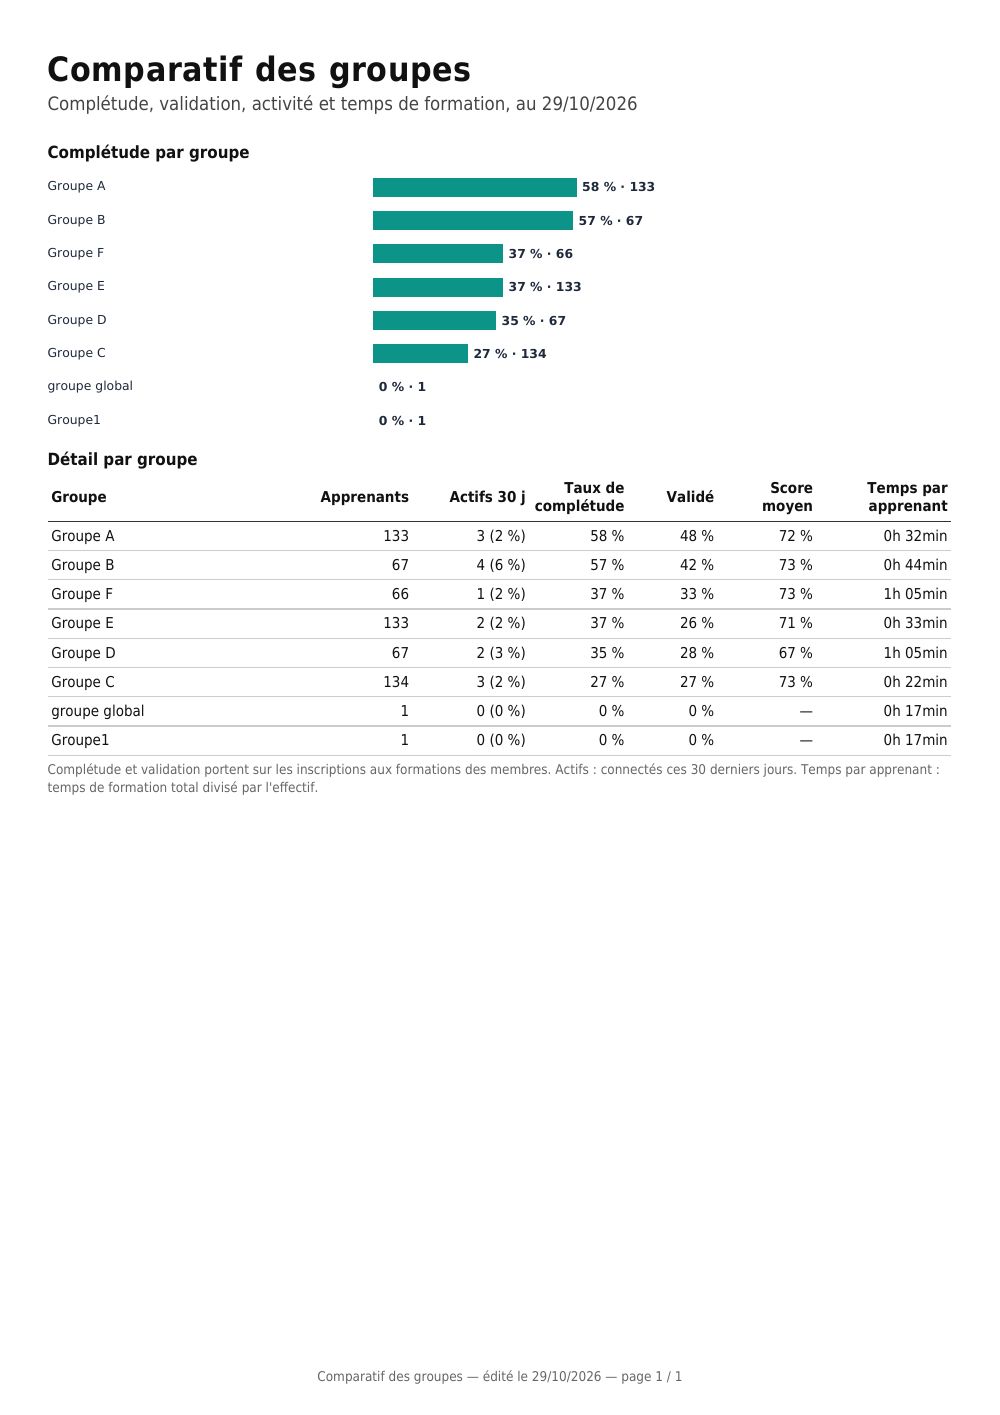
| Group comparison (Comparatif des groupes) | the whole platform | each group: completion, pass rate, activity, training time, ranked |
A typical page of each, taken from a demonstration platform (pages are in French; click to enlarge):


These templates are locked
The PDF rendering engine
In a template's editor, the PDF rendering engine setting offers two engines:
- Classic: the long-standing engine, compatible with all templates. All existing templates use it and keep it.
- New engine: vector charts with their labels (histograms, ring charts, Sankey diagrams), and long tables that continue cleanly on the next page. The zone placed at the bottom of the page becomes a real page footer, repeated on every page, with the actual page numbering.
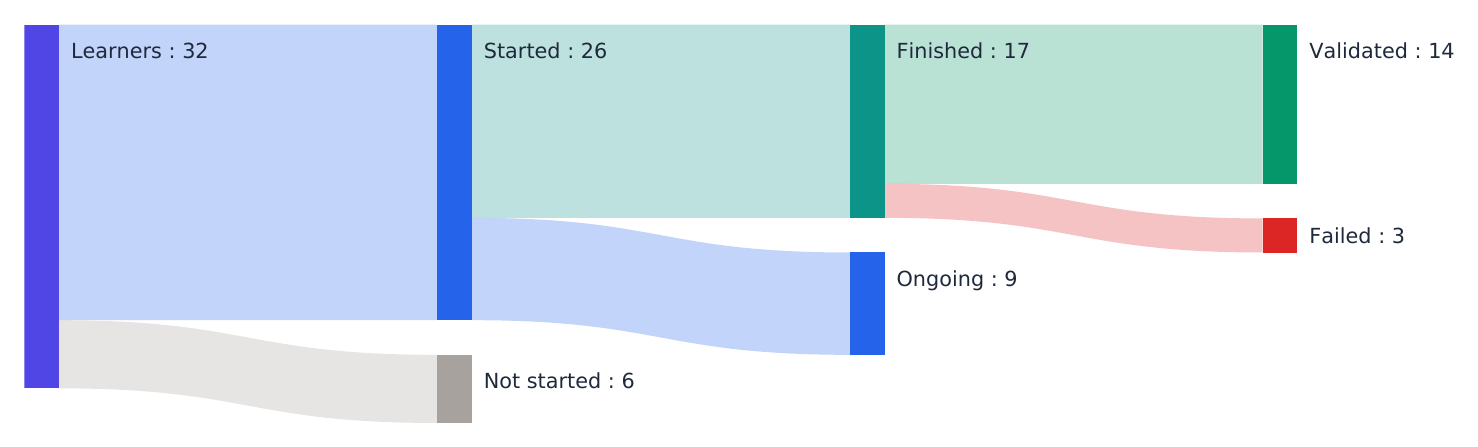
The supplied templates use the new engine, except the certificate of completion, an official document whose layout stays to the millimetre. The session review, key indicators, manager dashboard and global report show the breakdown of learners as a ring chart and their flow as a Sankey diagram: how many started, how many finished, how many passed — you see at a glance at which step they drop out. These two charts are also offered in the editor's list of variables, for your own templates (session, course, activity, group).
Charts added with the editor (pie, radar, histogram, bars) follow the chosen engine: under the new engine, they are redrawn with their labels inside the chart.
The supplied templates show a "Locked" badge in the list. You use them as normal, but you cannot edit or delete them: neither the pencil nor the bin appears on their row.
This is not a permissions restriction, it is a protection for the document. A certificate of completion given to a funder, or a summary sent to a skills operator (OPCO), must not be distorted by mistake with no way back to the original.
To adapt one to your brand style, duplicate it: the duplicate button is still available. The copy belongs to you, is not locked and can be edited freely — the original stays alongside as a reference. This also lets you compare the two if your version stops producing what you expected.
A locked template is exported as a .zip like any other, and it stays locked after being re-imported on another instance: the lock travels with the document.
Charts in the new engine
Here is what each chart draws under the new engine, on demonstration data. Colours are the platform's, and labels and values are written inside the chart: it stays readable when printed in black and white.
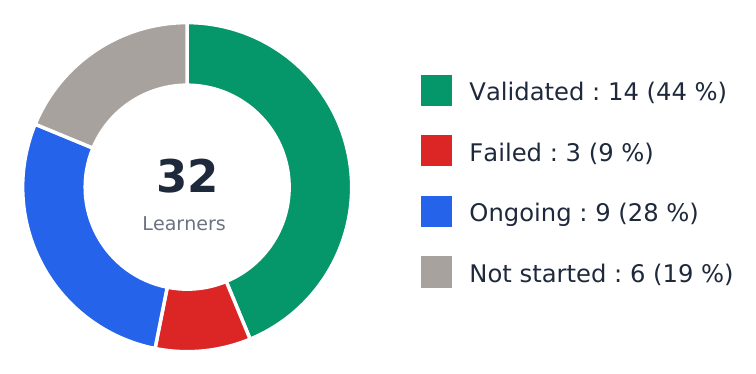
Breakdown of learners — a ring, the total in the centre, each status with its headcount and share. Variables @m_session_statusChart@, @m_course_statusChart@, @m_sco_statusChart@, @m_group_statusChart@ (text zone); in a chart zone, @lsp_cSession@, @lsp_cCourse@, @lsp_cSco@.
Learner flow — a Sankey diagram: how many started, how many finished, how many passed or failed. The thickness of each band is proportional to the headcount: you see at a glance at which step learners drop out. Variables @m_session_statusFlow@, @m_course_statusFlow@, @m_sco_statusFlow@, @m_group_statusFlow@. It only exists under the new engine, and is not shown when nobody has started.
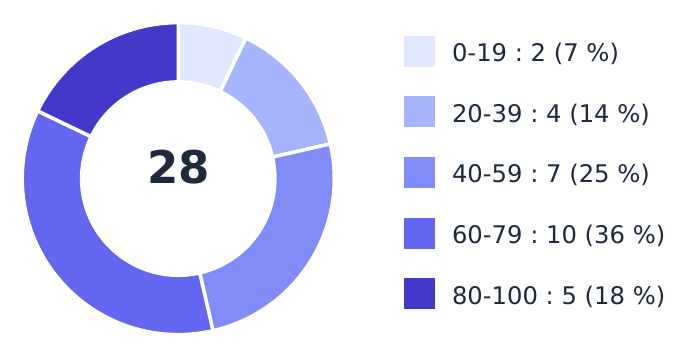
Score distribution — a ring per score band, in a single hue from light to dark (bands are an order, not categories). Variables @ssp_cSession@, @ssp_cCourse@, @ssp_cSco@.
Minimum, average and maximum score — the three values and a bar showing the range: two groups averaging 70% are not alike if one goes from 65 to 75 and the other from 10 to 95. Variables @mmasb_cSession@, @mmasb_cCourse@, @mmasb_cSco@.

Average score — a bar graduated out of 100. Variables @sb_cSession@, @sb_cCourse@, @sb_cSco@.

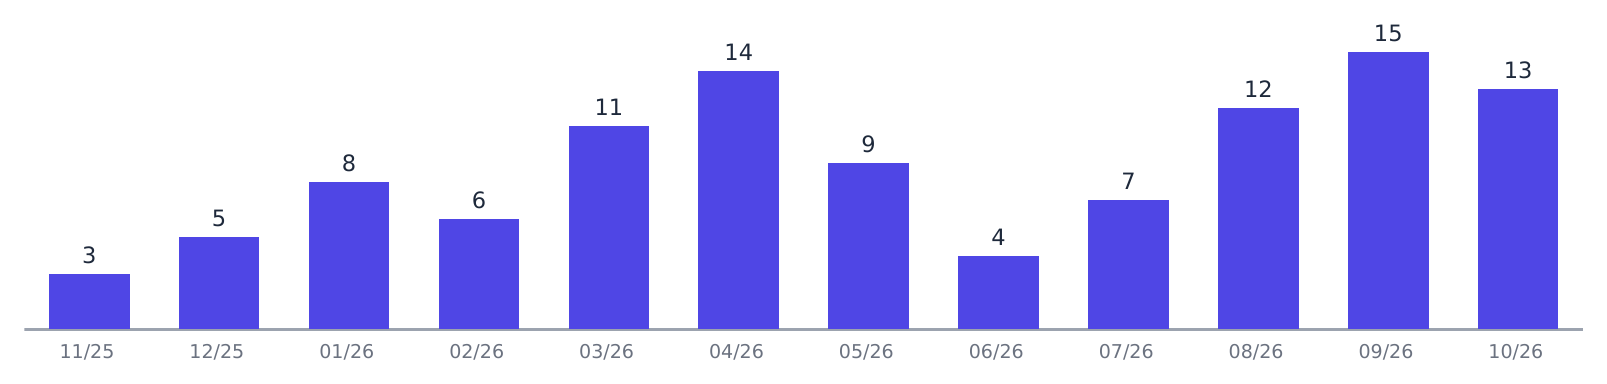
Month-by-month activity — a histogram, with the value above each bar. Active learners: @m_session_activityHistogram@, @m_group_activityHistogram@, @m_globales_activityHistogram@; logins and attempts: @tl_cSession@, @tl_cCourse@, @al_cCourse@, @al_cSco@.
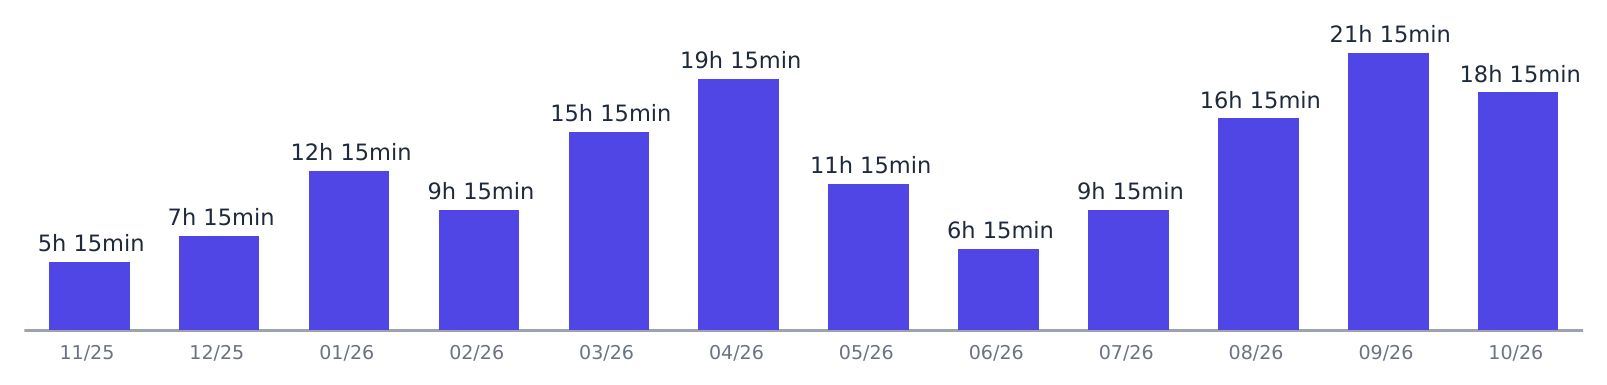
Training time — the same histogram, in hours and minutes, per month or per year. Variables @ftbm_cGlobal@ (per month) and @ftby_cGlobal@ (over twelve months).
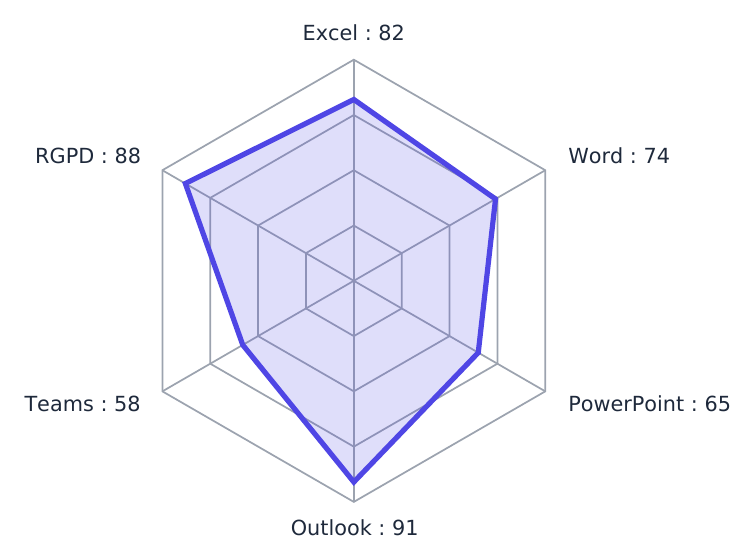
Score radar — one axis per session, course or skill, with the value written at the end of each axis. Variables @rs_usersSessions@, @rs_userCourses@, @rs_sessionCourses@, and for skills @rs_cCompetency_{level=0}@ or @rs_cCompetency_{level=objective}@.
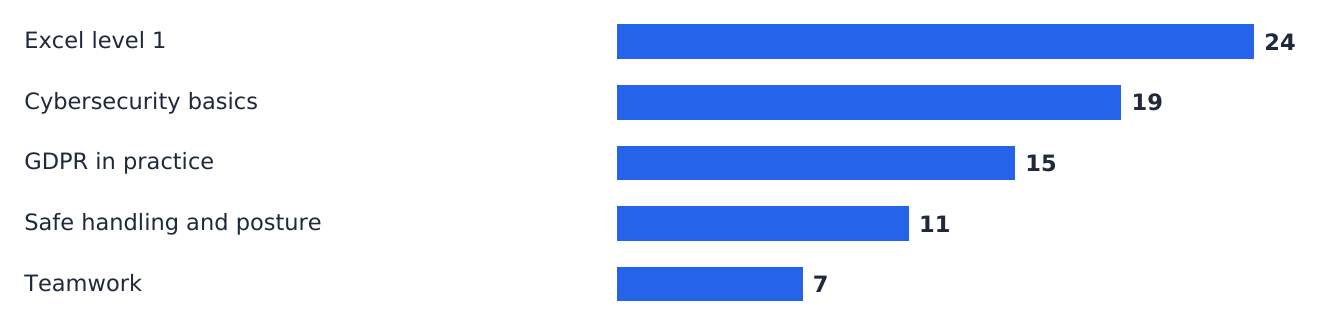
Course ranking — horizontal bars, from the most followed to the least followed. Variables @m_session_courseConsumption@ and …Low@ (least followed), and likewise for group, user and globales.
Under the classic engine the same variables still work: rings, radars and histograms are drawn without labels inside the drawing, the breakdown becomes a stacked bar and the learner flow does not appear.
Reports by course, by learner and by group
Eight templates complete the series. They all use the new engine.
By course — to produce one document per course, choose the course(s) in the selection step, just as you choose sessions for a session summary.
- Course learning review. It covers the course across all sessions. Its "Where learners drop out" page gives, for each activity in course order, the share of enrolled learners who started and finished it, with the average score and time against the planned duration. The biggest drop from one activity to the next is highlighted: that is the activity to review first. Then come the ten least successful questions (at least three answers) and the anonymous answers to the course's satisfaction surveys.
- Session comparison for a course. One row per session that includes the course. Same content, different results: a clear gap points to the cohort, the schedule or the support. The chart keeps only sessions where someone has started; the table keeps them all.
By learner
- Learner training file. The document for an audit or a funder: key figures, time logged in month by month, skills gaps against their job, then each course activity by activity (status, score, time, attempts, last access), and their certifications.
- Login log. Each login with its date, start time, last activity and duration, then monthly totals and time spent per course. It is the proof of completion funders ask for in distance learning. The duration is the time between opening the login and the last recorded action: a window left open without activity is not counted beyond that.
- Learner progress check. For each session, each course with its progress, its deadline — the end of the course in the session if set, otherwise the end of the session — and an Overdue flag (deadline passed, course not finished) or Due in N days (less than two weeks). Then the next activities to do, in the order of each course. For the learner, their tutor or their apprenticeship mentor.
By group
- Mandatory training compliance. A course is mandatory when the Mandatory course box is ticked in its options. For each member and each mandatory course assigned to them, the report counts what is up to date, overdue, in progress and not started, and gives the compliance rate. The list of actions follows, ranked by urgency — overdue, then not started, then in progress: the manager's reminder list. A second page lists certifications that have expired or expire within 90 days. The email address appears under each name, to tell two namesakes apart.
- Group skills needs. For each member assigned to a job, the platform measures what is missing for that job — certifications and skill levels — with the same rule as the "My progression path" screen. The report groups these gaps: how many members lack each certification or skill, and which courses would close the most of them. It is the basis of a skills development plan. A member with no job has no measurable gap and is counted separately.
For the whole platform
- Group comparison. Each group with its completion, pass rate, learners active over 30 days, average score and training time per learner, ranked by completion.
Like the platform report, these reports cover what you are allowed to see: a trainer only sees the learners of their own sessions and groups. They also respect the user selection made in Analysis.
The KPI report and its grid
This template does not just show rates: it assesses them, using the DGT Concept evaluation grid. "68%" means nothing to a steering committee; "68% — Good" does.
Two scales are conditional, and that is what makes them accurate:
- completion is assessed according to whether the course is tutored ("Steered course" box) — human support changes everything: Low is < 20% without tutoring, but < 50% with it;
- participation is assessed according to whether the course is mandatory ("Mandatory training" box) — a regulatory course at 55% is a failure, an optional course at the same rate a success.
In practice, in the same report, a course at 49% can be rated Good and another at 51% rated Medium: this is not a mistake, they are two different scales.
The footer always restates the scales applied — an indicator that cannot be challenged is not an indicator.
Engagement (time spent relative to planned time) shows "—" when the planned duration is not filled in on the course: without it, the rate would be meaningless, and a zero would wrongly read as total disengagement.
On the certificate, the organisation's legal details (company name, training provider registration number, signatory) need to be completed — they appear in square brackets.
The global report, and its limit
This document is the only one that covers the whole platform: a summary page, then one page per session. On the summary page, each session name is a link: clicking it takes you straight to its detail in the same PDF.
Spaces with no session at all are also included, with their counters at zero. This is intentional: a space that is open but unused shows up nowhere else. Its rate shows "—" rather than 0%, which would read as a failure when there is simply nothing to measure.
> ⚠️ Do not enable "one file per set of pages" on this template. Each session would then go into a separate PDF, and the links in the summary would no longer lead anywhere.
The platform report
This is the complete monitoring report, over several pages:
Overview
spaces, learners (active accounts, logged in over the last 30 days, never logged in), trainers, groups, sessions (ongoing, upcoming, ended) and courses (active, draft, to revalidate, archived), then the spaces table.
Activity and follow-up level
active learners month by month over a year, breakdown of enrolments (passed, failed, in progress, not started), completion and participation rates, learners dropping out, courses never opened — listed by name — and the most followed courses.
Courses
one line per course, with enrolled learners, progress, completion, average score and average time.
Groups
headcount, learners active over 30 days, courses passed, training time.
One page per session, as in the global report.
The report covers what you are allowed to see: the whole platform for an administrator, your space for a space administrator, your sessions and groups for a trainer.
This report uses the new PDF engine: the breakdown of enrolments is shown as a ring chart, their flow as a Sankey diagram (enrolled → started → finished → passed or failed), activity as a histogram, and the most followed courses as bars. If the new engine is not yet installed on your platform, the report comes out with the classic engine, without these charts but with the same figures.
The courses and groups tables stop at the sixty fullest lines, so that the document stays readable; the number of lines left out is shown under the table. The follow-up breakdown counts enrolments: a learner enrolled in two sessions counts twice.
Three documents that need a word of explanation
Most and least followed courses. "Followed" means actually opened: a course assigned to three hundred people, none of whom has started it, does not appear at the top of the ranking. This is intentional, and it is often the most useful information in the document. A course missing from both tables has never been opened by a learner in the scope.
Trainee hours. This document covers the educational part of an annual report: headcounts, hours, type of training. It does not cover the financial part — income, costs, subcontracting — and cannot: the platform holds no accounting data. The hours recorded are also the hours actually spent in the content, not the hours planned in the programme; the planned duration is shown alongside so that the gap remains readable.
Skills gaps by position. The comparison is based on the positions framework. A learner with no linked position does not have a zero gap: they have no requirement to compare against, and the document says so rather than showing an empty table that would read as "everything is covered".
If you build one yourself
Two engine constraints, invisible but unforgiving:
- A zone must reach the right-hand edge of the page to be rendered. The page is assembled in rows, and a row is only output when a zone reaches 200 mm from the left. A narrower zone that ends a row is never displayed — the page comes out blank, with no error message. Two zones side by side work, provided the second one reaches that edge.
- Loop markers do not go inside a table. The editor wraps them in a paragraph, which a table cannot contain: the browser moves it above the table, the two markers end up together, and the loop no longer wraps anything. For a repeated table, put the header in a first table, outside the loop, and the data row in a second table inside the loop.
The texts are supplied in French in every language: if your learners use the platform in another language, translate the zones from the editor by switching the editing language.
Large volumes: the three thresholds
A "one document per learner" report produces a page — sometimes a file — per person. With a broad filter, generation runs into hundreds of pages and several minutes. Three thresholds protect the tool, adjustable in Administration → Configuration:
| Number selected | What happens |
|---|---|
| Up to the preview threshold (100 by default) | On-screen preview and download |
| Up to the deferred threshold (250 by default) | Direct download. The preview is disabled and a message says so |
| Above that | The report is queued. It is produced in the background, then an email brings you a download link |
The link received by email is valid for 7 days by default (adjustable). After that, the file is deleted from the server: you need to run the generation again.
Three useful points:
- The link is personal. You must be logged in, with the account that requested the report. A forwarded link gives access to nothing — a report contains learners' personal data.
- An email address is required on your account, otherwise queuing is refused with a message: without an address, the report could not be delivered to you.
- The thresholds only apply to per-learner reports. A CSV export of several thousand rows is produced in a second and is not affected.
> On the server side, deferred generation relies on a scheduled task. If reports stay "being generated" indefinitely, that is what to check with your hosting provider.
- Templates can have their own dedicated custom fields.
- A report can be sent automatically by an automation ("Send a report" action), by email as an attachment/link or by upload to a server.
- For a simple results export with no layout, see "Export results to CSV".