How it works
A survey question is a choice question — single choice, multiple choice or true/false — with no right answer: it does not count towards the score, shows no correction, and is used to collect an opinion ("Which example spoke to you most?"). Answers are recorded and counted, without names.
Not to be confused with the satisfaction survey activity, a full questionnaire (scales, recommendation, free text) placed in the course: survey questions, on the other hand, are inserted along the way in a module or a test.
Create a survey question
In DGT Studio
on a quiz page, add a single-choice, multiple-choice or true/false question, then tick Survey (not scored). Right answers, points and feedback disappear from the editor.
In a quiz
the same Survey (not scored) box, on the same question types.
In Markdown
in a
::: quizblock, write? (enquete)for a single choice or? (enquete-multiple)for a multiple choice.
On the learner side, the question is tagged Your opinion and confirms Answer recorded, thank you! once validated. A quiz made only of survey questions thanks the learner instead of showing a score, and counts as completed — neither passed nor failed.
Read the results
Open the screen
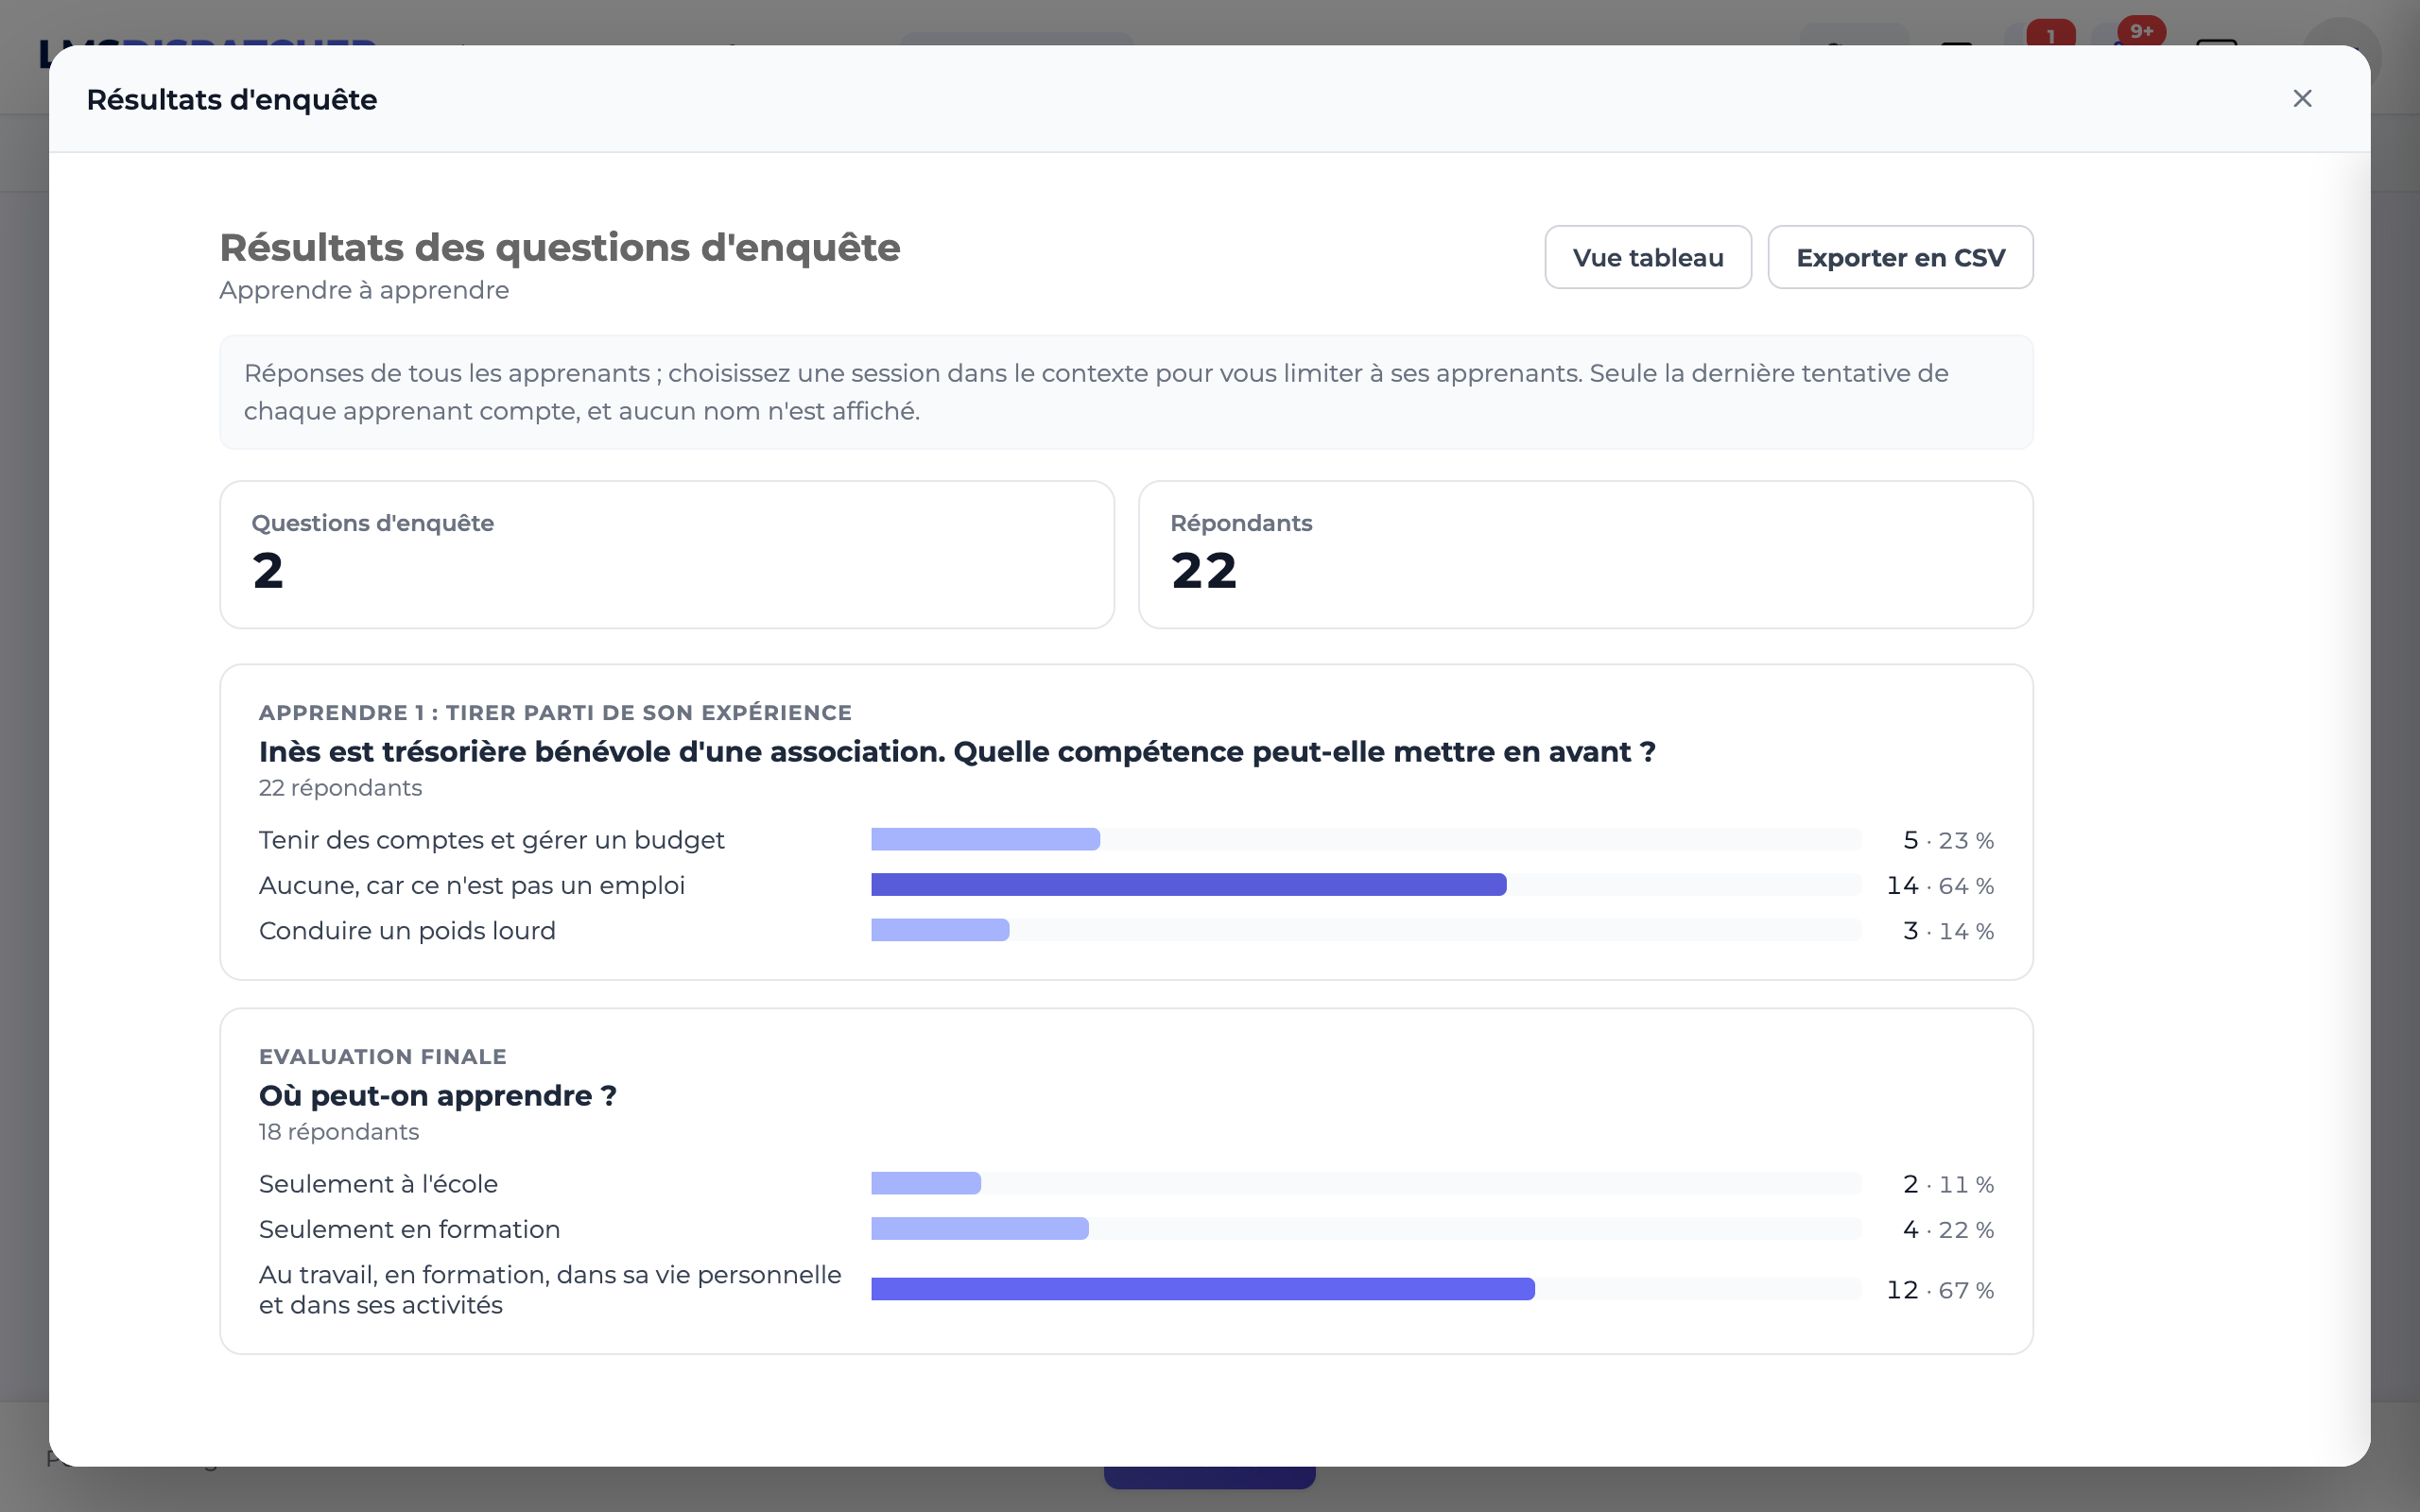
Edit the course, go to the Content tab, then Survey results. The button only appears if the course contains at least one survey question.
Choose the scope
With no session chosen in the context, the screen counts all learners; with a session, only its learners.
Read the indicators
Number of survey questions, of respondents and, in a session, the number enrolled and the response rate.
Read each question
One bar per answer, the most chosen answer in solid colour, with the count and the percentage; details appear on hover.
Switch views
Table view shows the same figures as tables; Chart view goes back to the bars. Your choice is remembered.
Export
Export as CSV to work on the figures in a spreadsheet.
In PDF reports
Four variables bring these results into a report template:
| Variable | Content |
|---|---|
@m_session_quizSurveyRespondents@ | Number of respondents in the session |
@m_session_quizSurveyDetail@ | Question-by-question detail, as bars, for the session |
@m_course_quizSurveyRespondents@ | Number of respondents for the course |
@m_course_quizSurveyDetail@ | Question-by-question detail, as bars, for the course |
With no survey question in scope, the number of respondents is "-" and the detail stays empty.
- Only the last attempt of each learner counts: redoing the module does not mean voting twice.
- Answers from all languages add up: a translated question is still the same question.
- Shuffling the answers of a quiz does not distort the counts: each answer is recorded under its original position.
- No name appears, on screen, in the CSV or in reports: only counts.